Monitor Databend Cloud
Databend Cloud provides monitoring functionality to help you gain a comprehensive understanding of your and your organization members' usage on the platform. To access the Monitor page, click Monitor in the sidebar menu on the homepage. The page includes the following tabs:
The SQL History and Audit tabs are visible only to admin members.
Metrics
The Metrics page presents charts that visually illustrate usage statistics for the following metrics, covering data from the past hour, day, or week:
- Storage Size
- SQL Query Count
- Session Connections
- Data Scanned / Written
- Warehouse Status
- Rows Scanned / Written
SQL History
The SQL History page displays a list of SQL statements that have been executed by all users within your organization. By clicking Filter at the top of the list, you can filter records by multiple dimensions.
Clicking a record on the SQL History page reveals detailed information on how Databend Cloud executed the SQL statement, providing access to the following tabs:
- Query Details: Includes Query State (success or failure), Rows Scanned, Warehouse, Bytes Scanned, Start Time, End Time, and Handler Type.
- Query Profile: Illustrates how the SQL statement was executed. For more information, see Understand Query Profile.
Query Profile
Query Profile refers to the graphical representation or visual breakdown of how a specific SQL statement is executed. It is essentially a graphical version of the EXPLAIN command, providing insights into the execution plan and performance details of the query.
Here is an example of a query profile, comprising a set of three operator nodes in a hierarchical structure. When executing the SQL statement, Databend Cloud processes the nodes in a bottom-to-top sequence. The quantity and types of operator nodes a query profile contains depend on the specifics of your SQL statement. For the common operators and their statistical fields, see Common Operators and Fields.
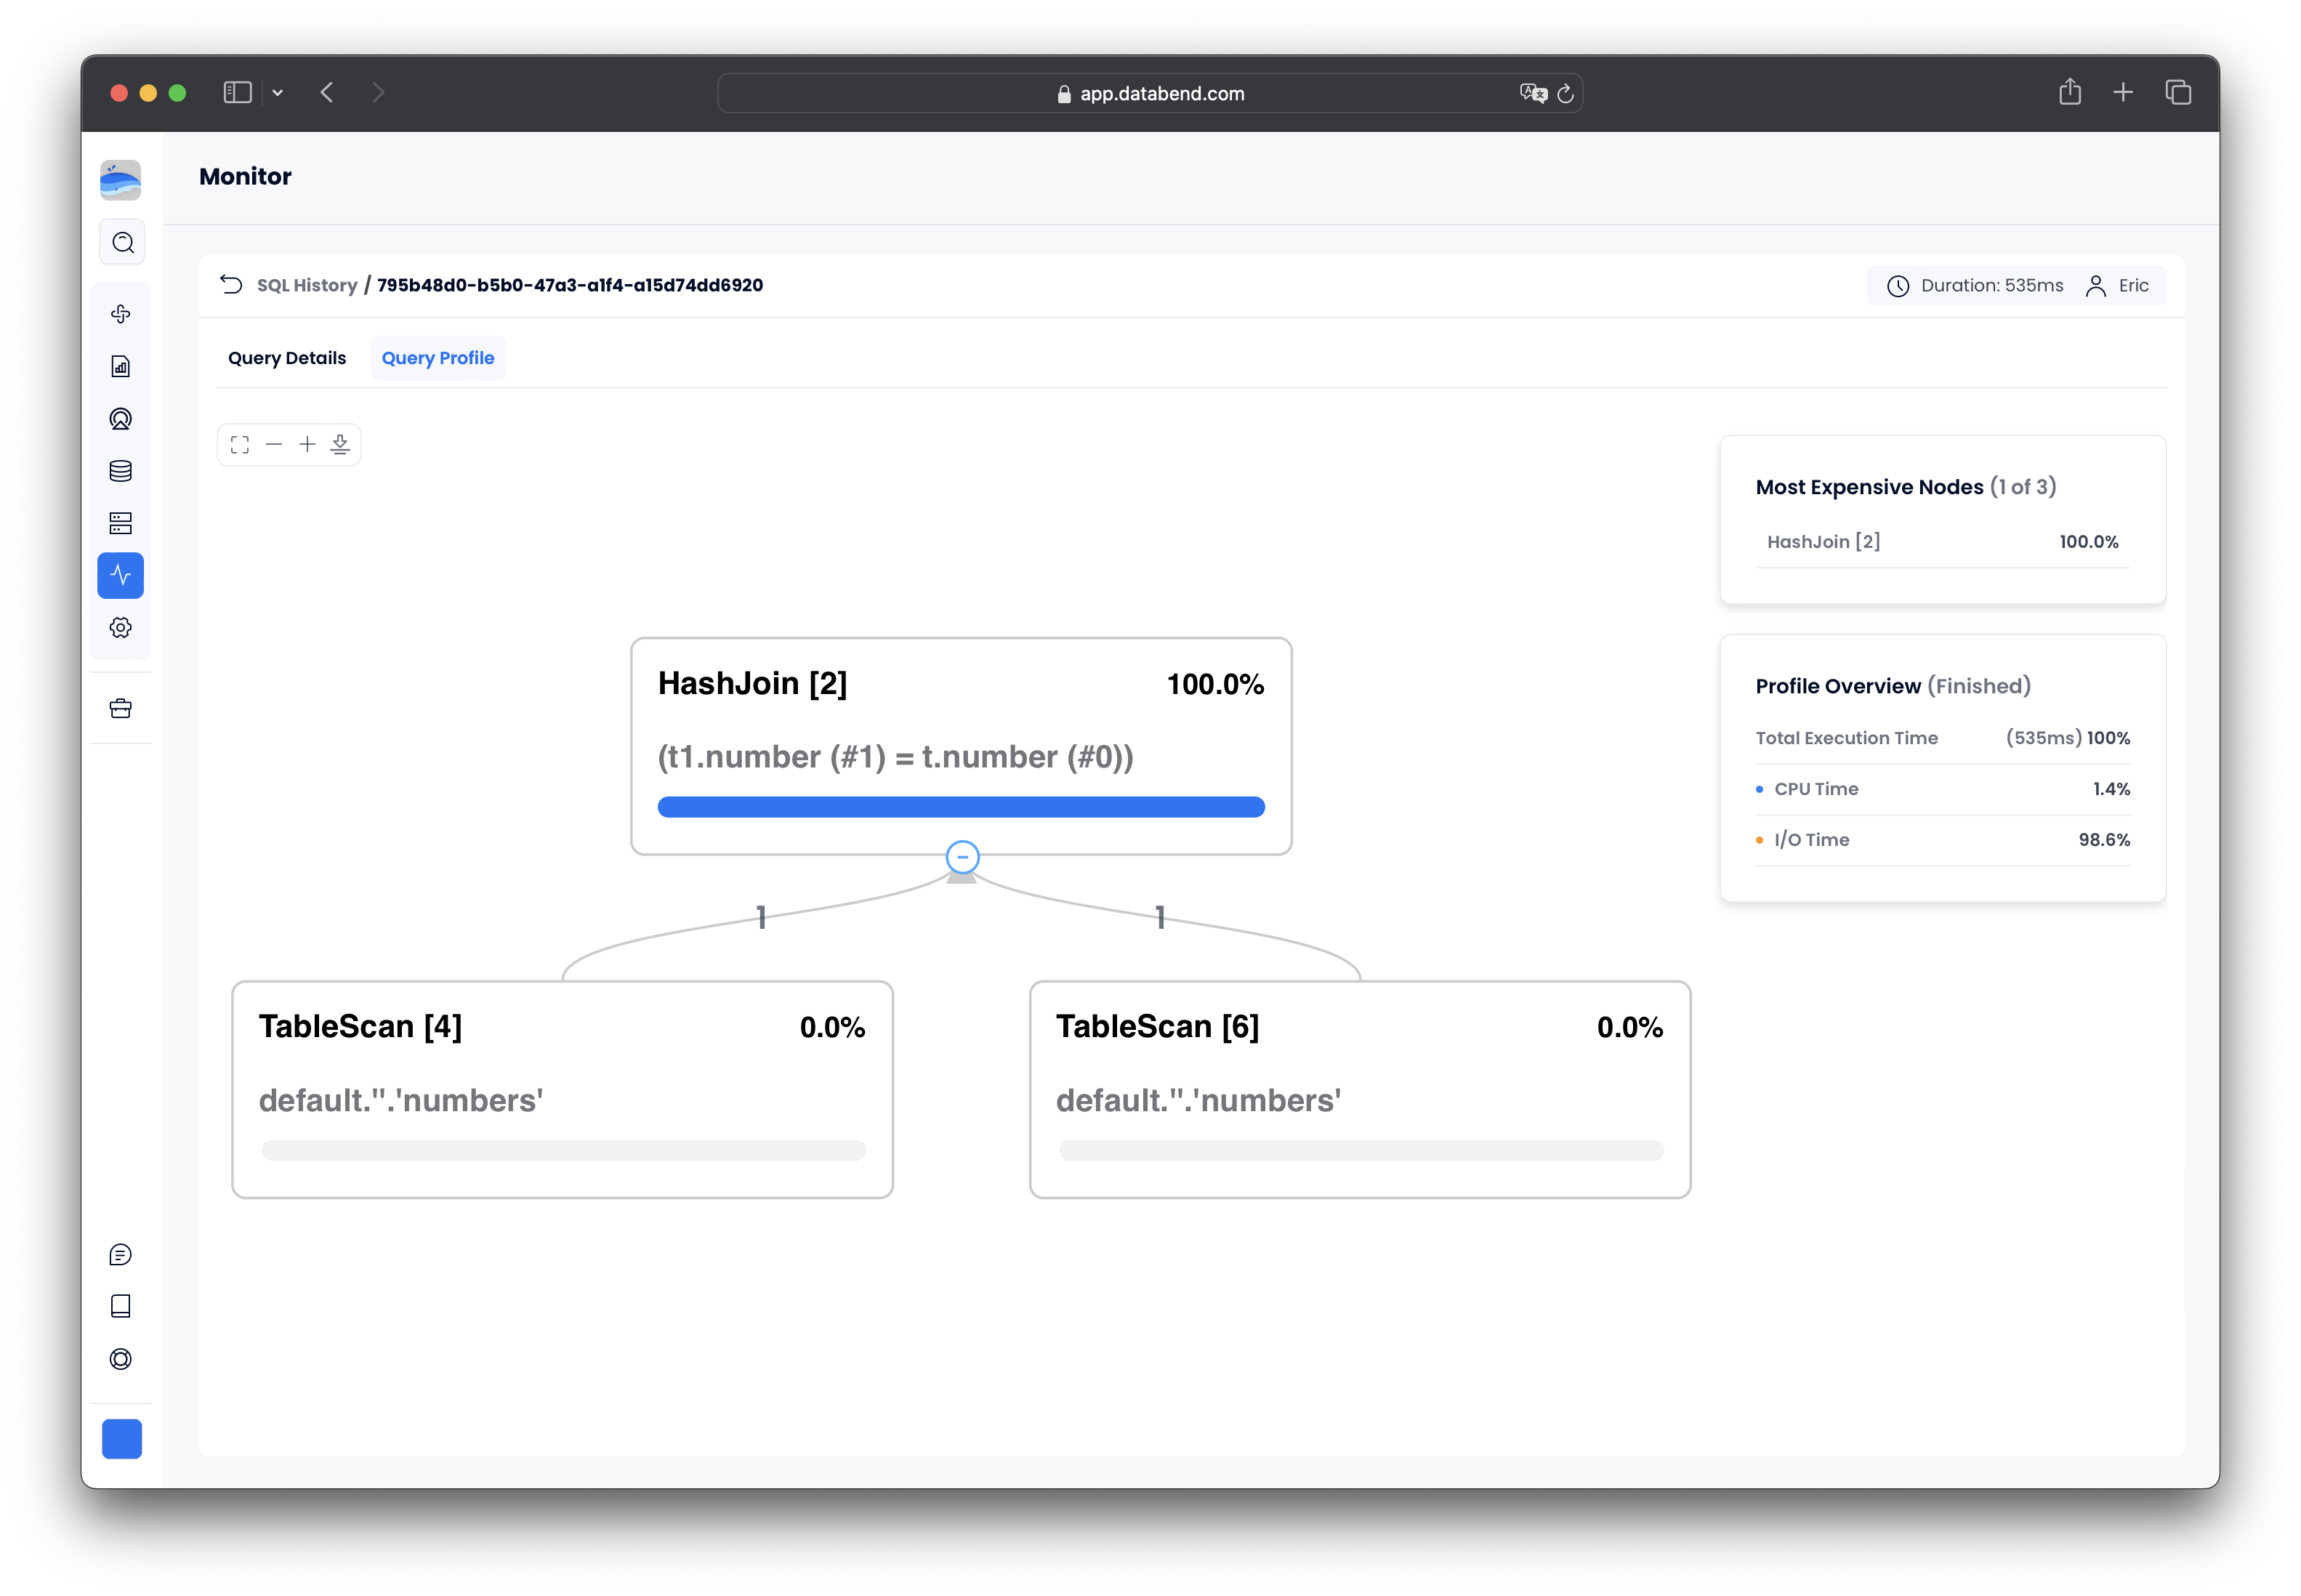
Please note that the bracketed number in each node's title represents the node ID and does not indicate the execution step.
A query profile comes with a set of information panes that offer more details. The example above includes two information panes:
| Pane | Description |
|---|---|
| Most Expensive Nodes | Lists the nodes with the longest execution times. |
| Profile Overview | Displays the percentage of time spent on CPU and I/O. Please note that if you select a node, this information pane shows the information specific to the node you select, rather than the whole query. |
If you click on the TableScan [4] node, you will notice that two additional information panes have been added to the right:
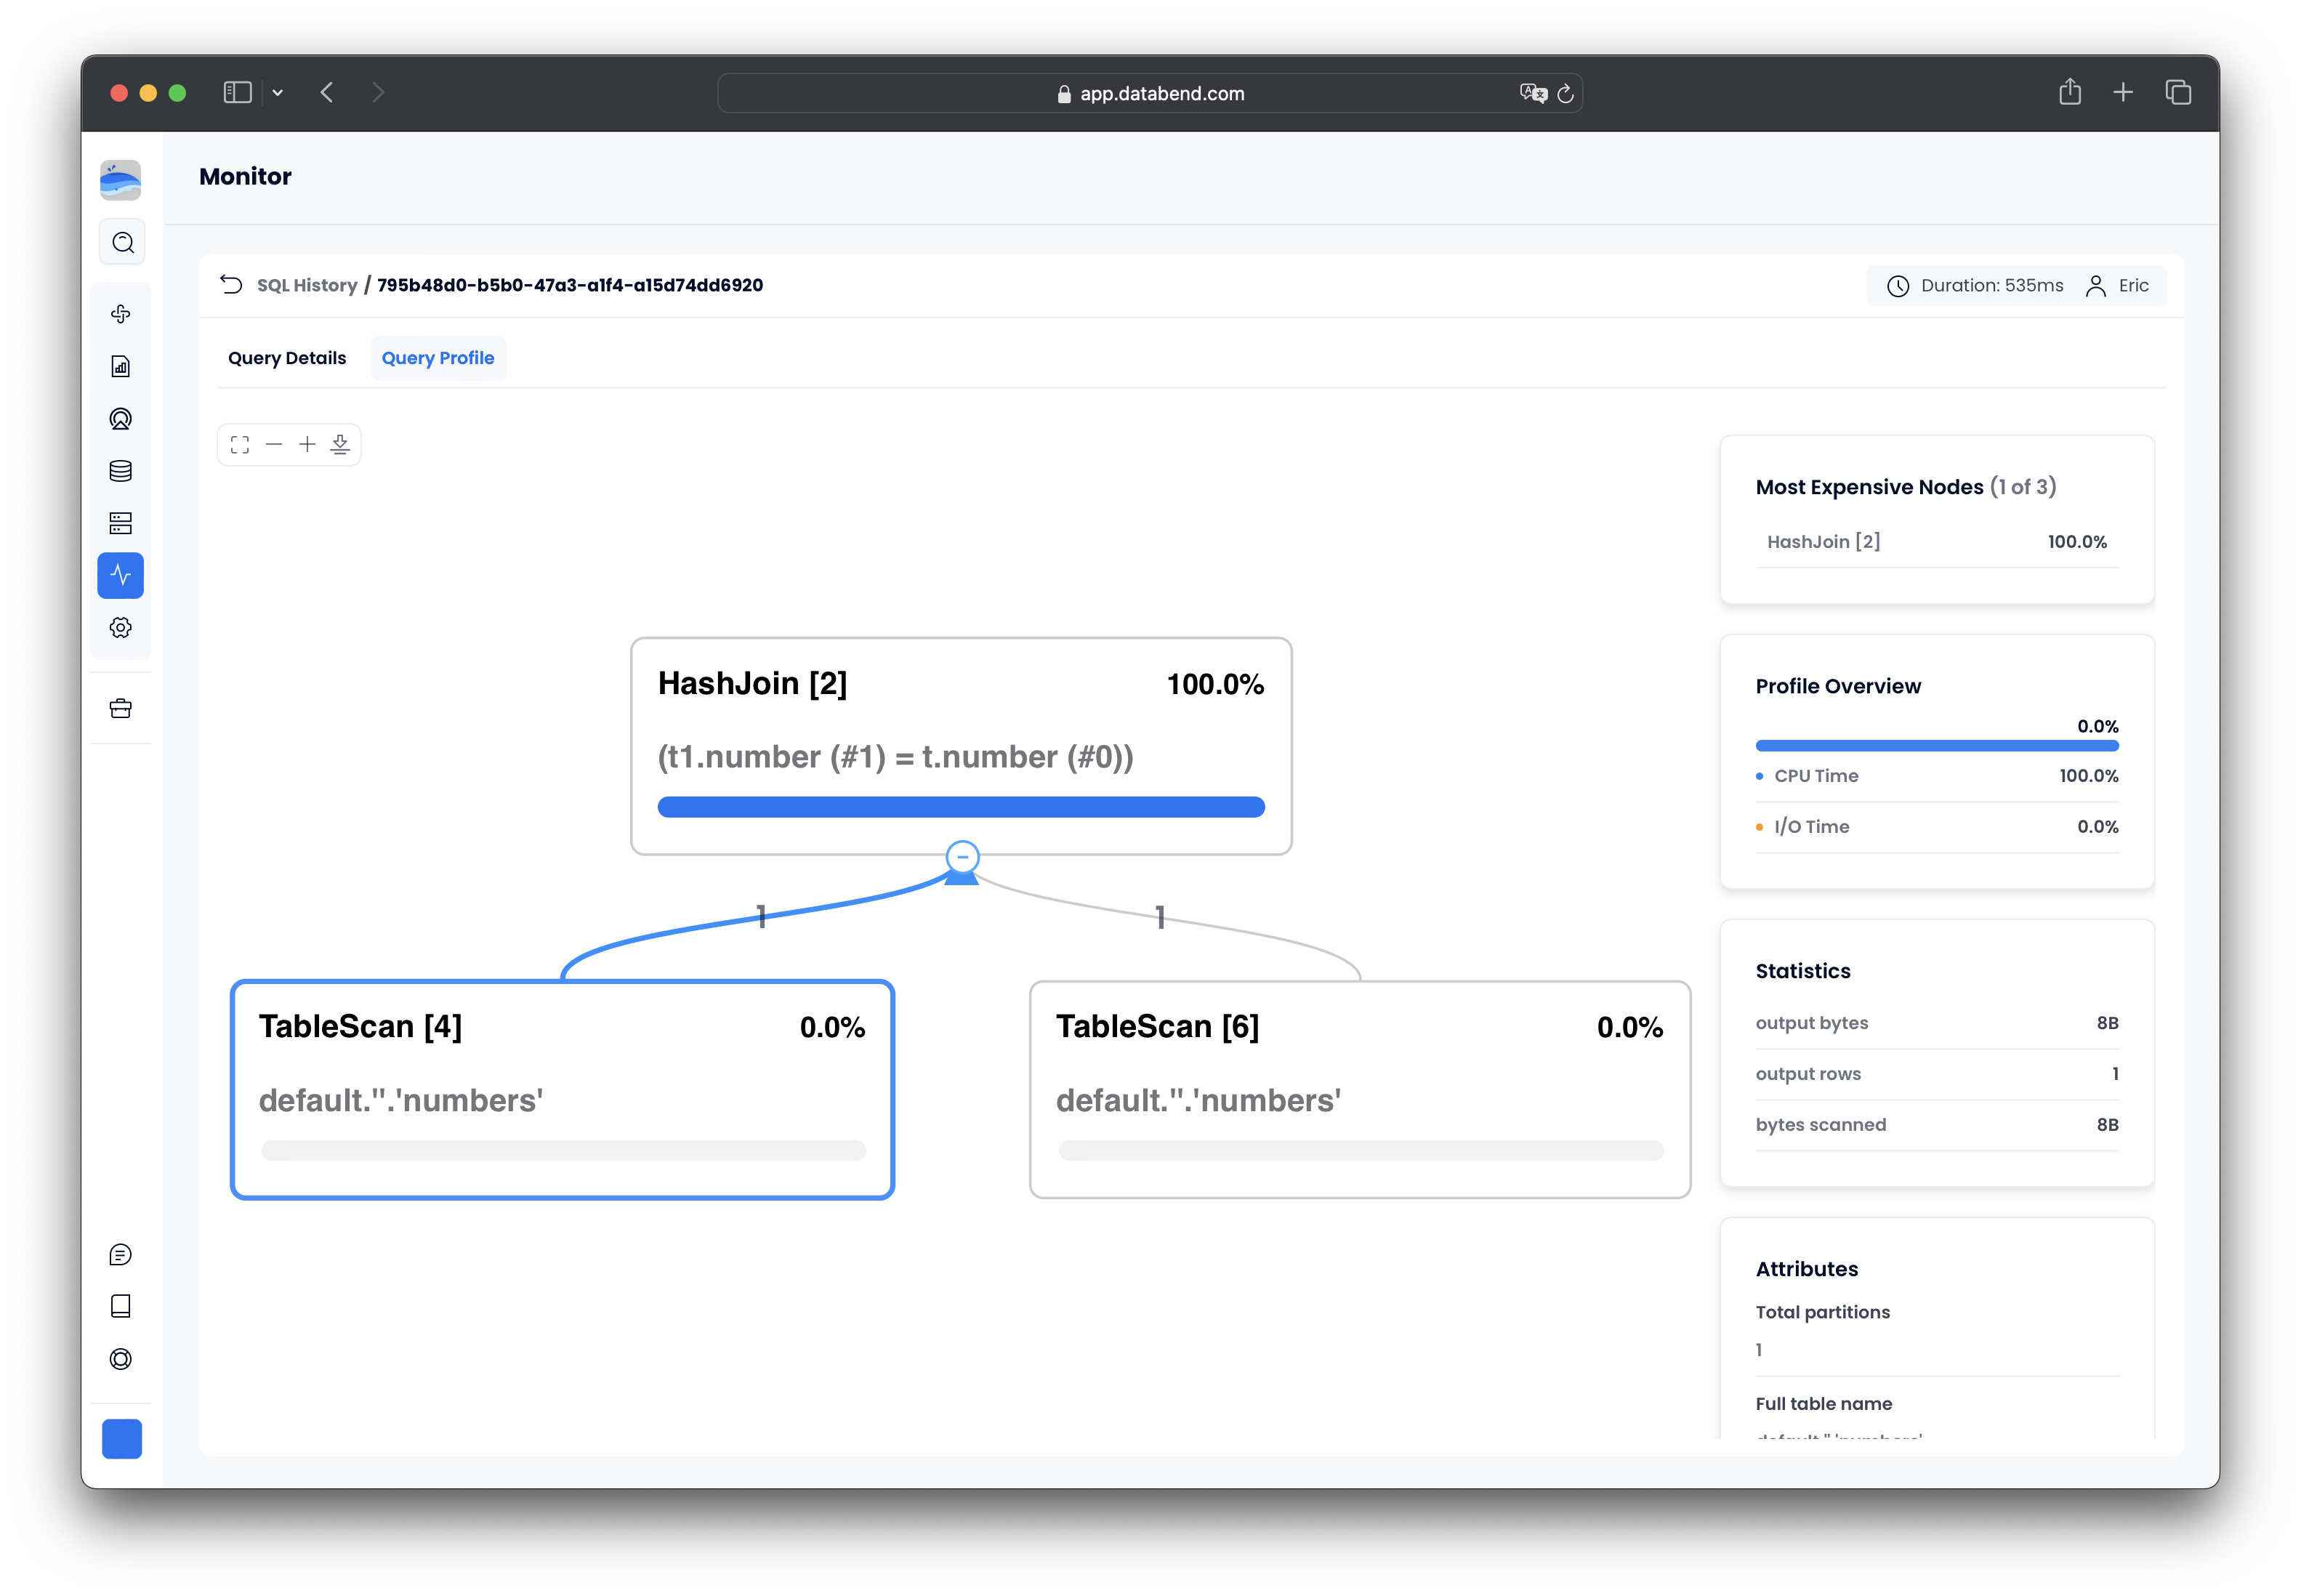
| Pane | Description |
|---|---|
| Statistics | Includes information such as scan progress, bytes scanned, percentage scanned from cache, partitions scanned, etc. |
| Attributes | Displays details specific to the node. The shown fields vary based on the functionality of the node. |
Audit
The Audit page records the operation logs of all organization members, including the operation type, operation time, IP address, and the account of the operator. By clicking Filter at the top of the list, you can filter records by multiple dimensions.