Geo Data using the Cell Tower Dataset
Load the OpenCelliD data in databend
Goal
In this guide you will learn how to:
- Load the OpenCelliD data in Databend
- Build a dashboard based on data available in the dataset
Get the Dataset
This dataset is from OpenCelliD - The world's largest Open Database of Cell Towers.
As of 2021, it contains more than 40 million records about cell towers (GSM, LTE, UMTS, etc.) around the world with their geographical coordinates and metadata (country code, network, etc).
OpenCelliD Project is licensed under a Creative Commons Attribution-ShareAlike 4.0 International License, and we redistribute a snapshot of this dataset under the terms of the same license.
Columns present in database
| Field | Description |
|---|---|
| Radio | The generation of broadband cellular network technology (e.g., LTE, GSM) |
| MCC | Mobile country code. This info is publicly shared by International Telecommunication Union |
| LAC/TAC/NID | Location Area Code |
| CID | This is a unique number used to identify each Base transceiver station or sector of BTS |
| Longitude | Longitude is a geographic coordinate that specifies the east-west position of a point on the Earth's surface |
| Latitude | Latitude is a geographic coordinate that specifies the north–south position of a point on the Earth's surface |
| Range | Approximate area within which the cell could be. (In meters) |
| Samples | Number of measures processed to get a particular data point |
| Changeable=1 | The location is determined by processing samples |
| Changeable=0 | The location is directly obtained from the telecom firm |
| Created | When a particular cell was first added to the database (UNIX timestamp) |
| Updated | When a particular cell was last seen (UNIX timestamp) |
| AverageSignal | To get the positions of cells, OpenCelliD processes measurements from data contributors. Each measurement includes GPS location of device + Scanned cell identifier (MCC-MNC-LAC-CID) + other device properties (Signal strength). In this process, signal strength of the device is averaged. Most 'averageSignal' values are 0 because OpenCelliD simply didn’t receive signal strength values. |
Load the sample data
Databend Cloud provides an easy-button for uploading this dataset from S3. Log in to your Databend Cloud organization, or create a free trial at Databend.cloud.
- Open the Loda Data menu from your Databend Cloud service and choose Load Data:
- Load sample data and select dataset Cell Towers in the Netherlands
- Select the target database, optionally provide a name for the current table, and then click the confirm button.
- After waiting for successful data loading, click 'Preview the table data' to verify if the data has been imported successfully.
Examine the schema of the cell_towers table
- Databend Cloud
- Use SQL Command
- Select "Data" from the left menu to access the Database Management.
- Choose the Data table created in the previous step to access its details.
- Click on "Table Definition" and "Columns" to view the schema definition of the table.
- Click "Data Preview" to check the imported data (providing a preview of up to the first 10,000 rows of data).
Examine the schema of the cell_towers table
DESCRIBE your-table-name
This is the output of DESCRIBE. Down further in this guide the field type choices will be described.
┌─name──────────┬─type──────────────────────────────────────────────────────────────────┬
│ radio         │ Enum8('' = 0, 'CDMA' = 1, 'GSM' = 2, 'LTE' = 3, 'NR' = 4, 'UMTS' = 5) │
│ mcc           │ UInt16                                                                │
│ net           │ UInt16                                                                │
│ area          │ UInt16                                                                │
│ cell          │ UInt64                                                                │
│ unit          │ Int16                                                                 │
│ lon           │ Float64                                                               │
│ lat           │ Float64                                                               │
│ range         │ UInt32                                                                │
│ samples       │ UInt32                                                                │
│ changeable    │ UInt8                                                                 │
│ created       │ DateTime                                                              │
│ updated       │ DateTime                                                              │
│ averageSignal │ UInt8                                                                 │
└───────────────┴───────────────────────────────────────────────────────────────────────┴
Build visualizations with Worksheet
Databend Cloud worksheets have built-in visualization capabilities that allow you to quickly turn queried data into visual charts.
Percentage of Cellular Network Technology Development
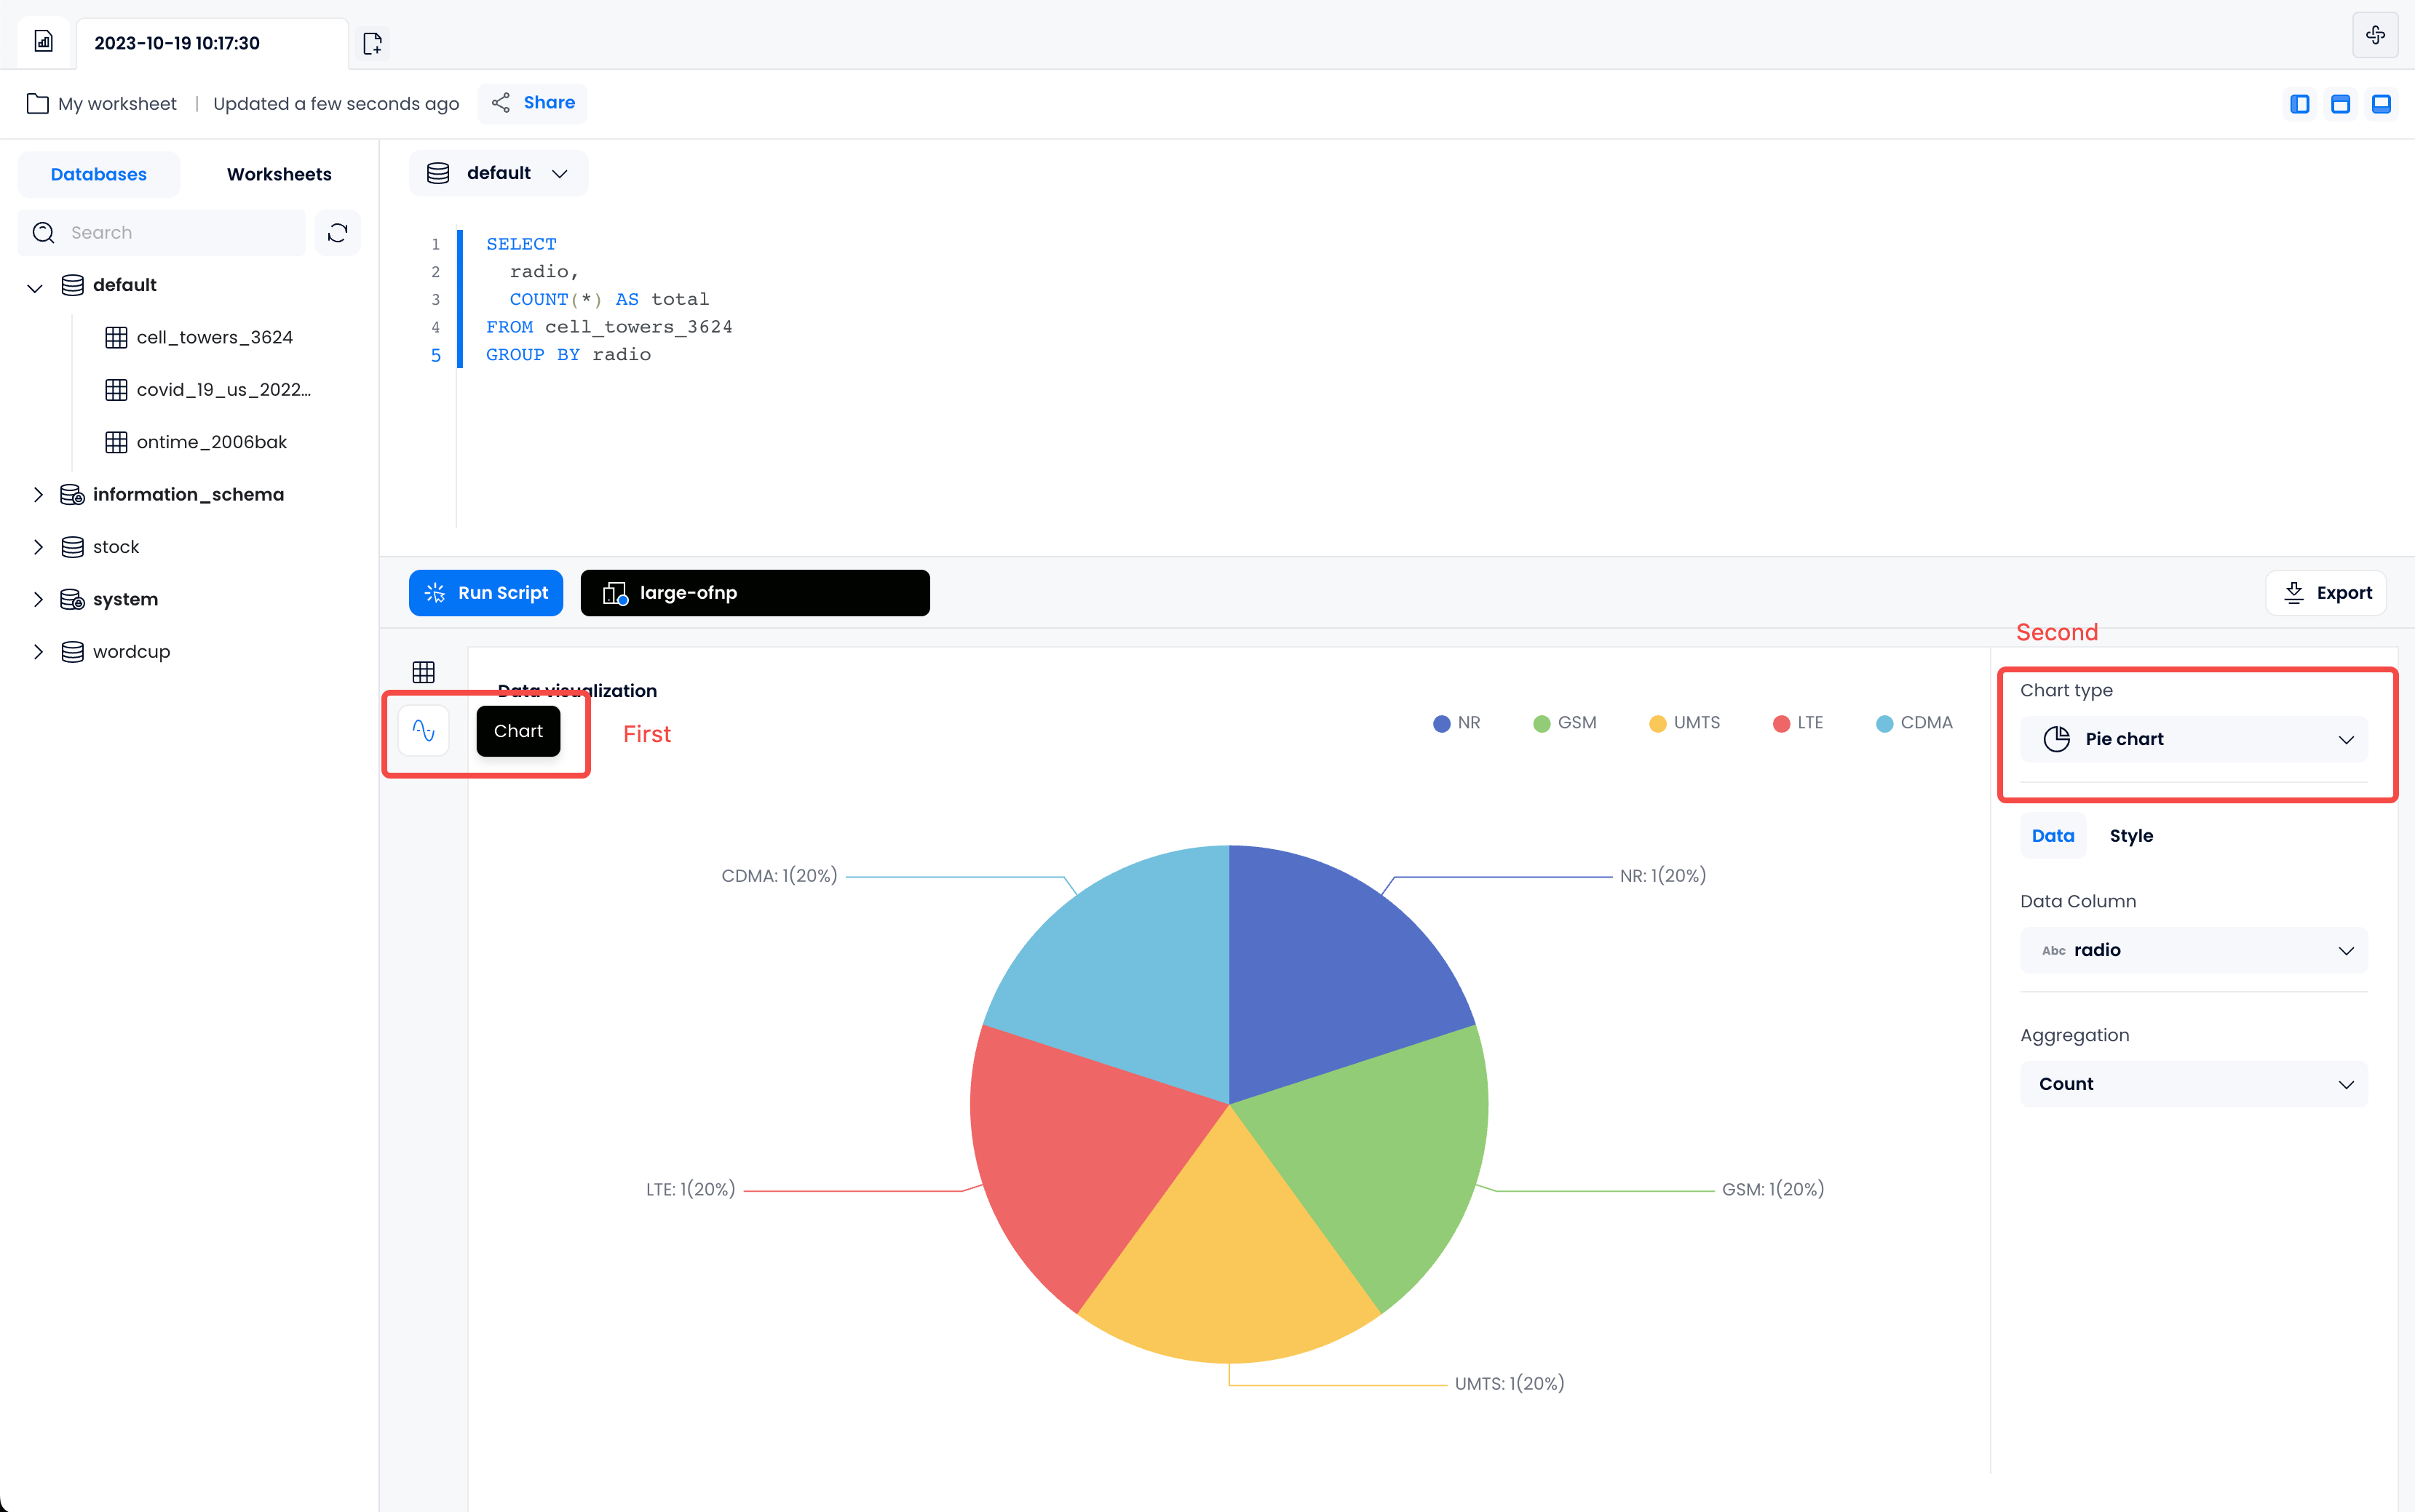
For example, we can examine the distribution of the development of broadband cellular network technologies (e.g. LTE, GSM) in the dataset, and use a pie chart to display the percentage of each development stage.
- Create a new Worksheet and query the previously created data tables using SQL statements.
SELECT
radio,
COUNT(*) AS total
FROM cell_towers_3624
GROUP BY radio
- Switch to the Chart view and select Pie chart to automatically convert the data into a visualized chart.