Deploying a Cluster on Kubernetes
This topic explains how to install and configure the Databend cluster on Kubernetes.
Deployment Architecture
Scenario Description
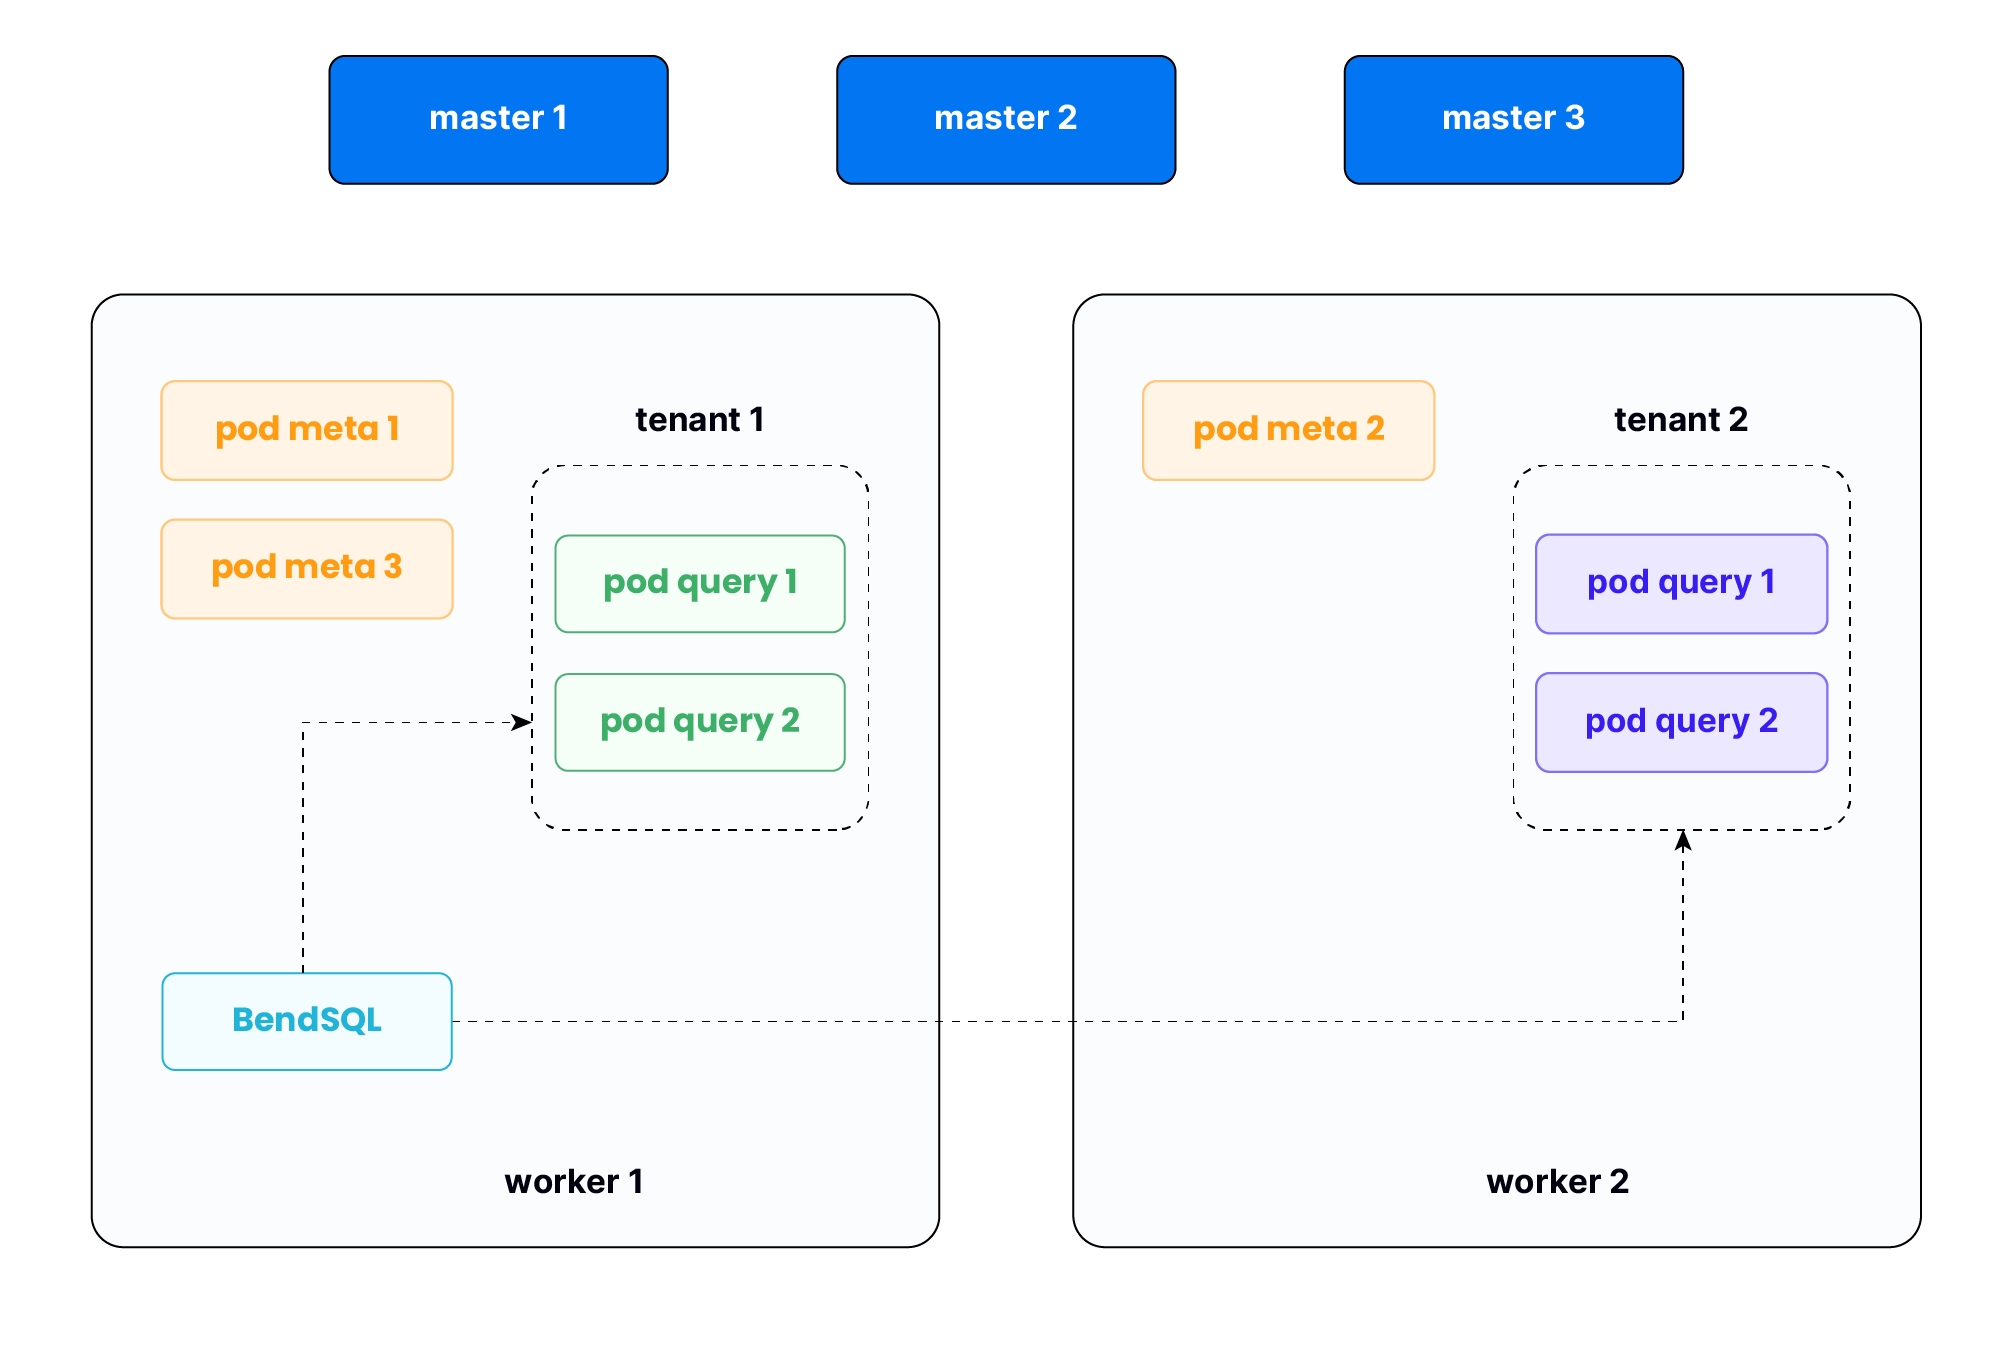
- This example demonstrates how to create a Databend cluster within a Kubernetes cluster that supports multi-tenancy. As illustrated,
tenant1andtenant2each have their own independent Databend Query clusters, while sharing a single Databend Meta cluster. - You will need administrative access to the Kubernetes cluster. You can choose any Kubernetes node to work on, but we recommend performing operations on the management node. For this example, you'll need to install both helm and the BendSQL tool on a worker node to execute commands.
Before You Begin
Plan Your Deployment.
In this example, you will deploy a Databend Meta cluster consisting of 3 nodes, as well as two separate Databend Query clusters, each also consisting of 3 nodes. You should manage and allocate resources according to your actual deployment plans and usage scenarios to ensure that services run smoothly.
For Production DeploymentsPlease refer to Deployment Environments to reserve appropriate resources for your clusters.
Ensure
helmcommand installed, see guideMake sure you have a Kubernetes cluster up and running. For example:
Also, there are simple Kubernetes Engines for local testing:
For Kubernetes Clusters on Remote ServersIt is recommended to set up an external load balancer or choose appropriate port forwarding rules to ensure that services are accessible.
Create a Cloud Object Storage with corresponding credentials, i.e.,
access_key_idandsecret_access_key.- AWS S3 or other S3 compatible storage service
- Azure Storage Blob
- Other storage services supported by Apache OpenDAL
Recommended Storage SettingsPreparing Storage provides detailed instructions on recommended storage settings.
For advanced userAuthentication methods without access keys are also supported:
- IRSA on aws
- RRSA on aliyun
- InstanceProfile on aws (coming soon)
Ensure there is a default storage class for the Kubernetes cluster.
For cloud platforms- EKS(AWS)
- ACK(Alibaba Cloud)
Amazon Elastic Block Store (EBS) CSI driver is recommended. And remember to set the annotation for default class when adding storage classes, for example:
storageClasses:
  - name: gp3
    annotations:
      storageclass.kubernetes.io/is-default-class: "true"
    allowVolumeExpansion: true
    volumeBindingMode: WaitForFirstConsumer
    reclaimPolicy: Delete
    parameters:
      type: gp3
❯ kubectl get sc
NAME PROVISIONER RECLAIMPOLICY VOLUMEBINDINGMODE ALLOWVOLUMEEXPANSION AGE
gp2 kubernetes.io/aws-ebs Delete WaitForFirstConsumer true 16d
gp3 (default) ebs.csi.aws.com Delete WaitForFirstConsumer true 15dEnsure component
csi-provisioneris installed, and then set the default storage class:❯ kubectl get sc
NAME PROVISIONER RECLAIMPOLICY VOLUMEBINDINGMODE ALLOWVOLUMEEXPANSION AGE
alicloud-disk-available diskplugin.csi.alibabacloud.com Delete Immediate true 66m
alicloud-disk-efficiency diskplugin.csi.alibabacloud.com Delete Immediate true 66m
alicloud-disk-essd diskplugin.csi.alibabacloud.com Delete Immediate true 66m
alicloud-disk-ssd diskplugin.csi.alibabacloud.com Delete Immediate true 66m
alicloud-disk-topology diskplugin.csi.alibabacloud.com Delete WaitForFirstConsumer true 66m
alicloud-disk-topology-alltype diskplugin.csi.alibabacloud.com Delete WaitForFirstConsumer true 66m
# select the wanted storage class as default,for example: alicloud-disk-topology-alltype
❯ kubectl annotate sc alicloud-disk-topology-alltype storageclass.kubernetes.io/is-default-class=true --overwriteRecommended Ensure Prometheus Operator running in Kubernetes cluster, if you want to monitor the status for Databend Meta and Databend Query.
Steps for a simple Kube Prometheus StackAdd chart repository for kube-prometheus-stack
helm repo add prometheus-community https://prometheus-community.github.io/helm-charts
helm repo update prometheus-community
Prepare a values file for simple kube-prometheus-stack installation
values.yamlgrafana:
grafana.ini:
auth.anonymous:
enabled: true
org_role: Admin
prometheus:
prometheusSpec:
ruleNamespaceSelector: {}
ruleSelectorNilUsesHelmValues: false
serviceMonitorNamespaceSelector: {}
serviceMonitorSelectorNilUsesHelmValues: false
podMonitorNamespaceSelector: {}
podMonitorSelectorNilUsesHelmValues: falseInstall Kube Prometheus Stack with helm
helm upgrade --install monitoring \
    prometheus-community/kube-prometheus-stack \
    --namespace monitoring \
    --create-namespace \
    --values values.yaml
Verify prometheus & grafana running
❯ kubectl -n monitoring get pods
NAME                                                     READY   STATUS    RESTARTS      AGE
monitoring-prometheus-node-exporter-7km6w                1/1     Running   0             19m
monitoring-kube-prometheus-operator-876c99fb8-qjnpd      1/1     Running   0             19m
monitoring-kube-state-metrics-7c9f7fc49b-4884t           1/1     Running   0             19m
alertmanager-monitoring-kube-prometheus-alertmanager-0   2/2     Running   1 (18m ago)   18m
monitoring-grafana-654b4bb58c-sf9wp                      3/3     Running   0             19m
prometheus-monitoring-kube-prometheus-prometheus-0       2/2     Running   0             18m
Deploy a Sample Databend Cluster
Step 1. Deploy a Databend Meta Cluster
- Create a values file with persistent and monitoring enabled:
Detailed and default values are available at documentation
bootstrap: true
replicaCount: 3
persistence:
  size: 20Gi
serviceMonitor:
  enabled: true
It is highly recommended to deploy an at least 3-nodes cluster with persistent storage on each node for high availability.
When replicaCount > 1, a bootstrap: true is necessary on first run,
and could be removed when all nodes in cluster are up and running.
- Deploy the meta cluster in namespace
databend-meta
helm repo add databend https://charts.databend.rs
helm repo update databend

helm upgrade --install databend-meta databend/databend-meta \
    --namespace databend-meta --create-namespace \
    --values values.yaml
- Wait and verify meta service running
❯ kubectl -n databend-meta get pods
NAME              READY   STATUS    RESTARTS        AGE
databend-meta-0   1/1     Running   0               5m36s
databend-meta-1   1/1     Running   1 (4m38s ago)   4m53s
databend-meta-2   1/1     Running   1 (4m2s ago)    4m18s

❯ kubectl -n databend-meta get pvc
NAME                   STATUS   VOLUME                                     CAPACITY   ACCESS MODES   STORAGECLASS   AGE
data-databend-meta-0   Bound    pvc-578ec207-bf7e-4bac-a9a1-3f0e4b140b8d   20Gi       RWO            local-path     5m45s
data-databend-meta-1   Bound    pvc-693a0350-6b87-491d-8575-90bf62179b59   20Gi       RWO            local-path     5m2s
data-databend-meta-2   Bound    pvc-08bd4ceb-15c2-47f3-a637-c1cc10441874   20Gi       RWO            local-path     4m27s
Step 2. Deploy a Databend Query Cluster
- Create a values file with builtin user
databend:databendand cluster nameexample_clusterwith 3 nodes.
Detailed and default values are available at documentation
replicaCount: 3
config:
  query:
    clusterId: example_cluster
    # add builtin user
    users:
      - name: databend
        # available type: sha256_password, double_sha1_password, no_password, jwt
        authType: double_sha1_password
        # echo -n "databend" | sha1sum | cut -d' ' -f1 | xxd -r -p | sha1sum
        authString: 3081f32caef285c232d066033c89a78d88a6d8a5
  meta:
    # Set endpoints to use remote meta service
    # depends on previous deployed meta service、namespace and nodes
    endpoints:
      - "databend-meta-0.databend-meta.databend-meta.svc:9191"
      - "databend-meta-1.databend-meta.databend-meta.svc:9191"
      - "databend-meta-2.databend-meta.databend-meta.svc:9191"
  storage:
    # s3, oss
    type: s3
    s3:
      bucket: "<bucket>"
      region: "<region>"
      access_key_id: "<key>"
      secret_access_key: "<secret>"
      root: ""
# [recommended] enable monitoring service
serviceMonitor:
  enabled: true
# [recommended] enable access from outside cluster
service:
  type: LoadBalancer
When setting the service type to LoadBalancer,
almost all cloud platform would assign a public ip address for the query service,
this may lead to security problem.
Then annotations would be necessary to tell the cloud platform create an internal loadbalancer.
For different cloud providers:
- AWS
- Alibaba Cloud
Recommended to have AWS Load Balancer Controller installed.
service:
  type: LoadBalancer
  annotations:
    service.beta.kubernetes.io/aws-load-balancer-type: external
    service.beta.kubernetes.io/aws-load-balancer-nlb-target-type: ip
    service.beta.kubernetes.io/aws-load-balancer-scheme: internal
service:
  type: LoadBalancer
  annotations:
    service.beta.kubernetes.io/alibaba-cloud-loadbalancer-address-type: "intranet"
- S3(aws)
- OSS(Alibaba Cloud)
- COS(Tencent Cloud)
config:
  storage:
    type: s3
    s3:
      # default endpoint
      endpoint_url: "https://s3.amazonaws.com"
      bucket: "<bucket>"
      region: "<region>"
      access_key_id: "<key>"
      secret_access_key: "<secret>"
      root: ""
config:
  storage:
    type: s3
    s3:
      # regional endpoint url
      endpoint_url: "https://oss-ap-southeast-1.aliyuncs.com"
      bucket: "<bucket>"
      access_key_id: "<key>"
      secret_access_key: "<secret>"
      # required
      enable_virtual_host_style: true
config:
  storage:
    type: oss
    oss:
      # regional endpoint url
      endpoint_url: "https://oss-ap-southeast-1.aliyuncs.com"
      bucket: "<bucket>"
      access_key_id: "<key>"
      access_key_secret: "<secret>"
config:
  storage:
    type: cos
    cos:
      # regional endpoint url
      endpoint_url: "https://cos.ap-singapore.myqcloud.com"
      bucket: "test-databend-1234567890"
      access_key_id: "<key>"
      secret_access_key: "<secret>"
- Deploy the query cluster for
tenant1in namespacedatabend-query
helm repo add databend https://charts.databend.rs
helm repo update databend

helm upgrade --install tenant1 databend/databend-query \
    --namespace databend-query --create-namespace \
    --values values.yaml
- Wait and verify query service running
❯ kubectl -n databend-query get pods
NAME                                     READY   STATUS    RESTARTS   AGE
tenant1-databend-query-66647594c-lkkm9   1/1     Running   0          36s
tenant1-databend-query-66647594c-lpl2s   1/1     Running   0          36s
tenant1-databend-query-66647594c-4hlpw   1/1     Running   0          36s

❯ kubectl -n databend-query get svc
NAME                     TYPE           CLUSTER-IP     EXTERNAL-IP   PORT(S)                                                                                     AGE
tenant1-databend-query   LoadBalancer   10.43.84.243   172.20.0.2    8080:32063/TCP,9000:31196/TCP,9090:30472/TCP,8000:30050/TCP,7070:31253/TCP,3307:31367/TCP   17m
Access the query cluster
We use the builtin user
databendhere:
in-cluster access
bendsql -htenant1-databend-query.databend-query.svc -P8000 -udatabend -pdatabendoutside-cluster access with loadbalancer
# the address here is the `EXTERNAL-IP` for service tenant1-databend-query above
bendsql -h172.20.0.2 -P8000 -udatabend -pdatabend
local access with kubectl
nohup kubectl port-forward -n databend-query svc/tenant1-databend-query 3307:3307 &
bendsql -h127.0.0.1 -P8000 -udatabend -pdatabend
- Deploy a second cluster for tenant2
modify the values.yaml for tenant2
# optional
helm repo update databend

helm upgrade --install tenant2 databend/databend-query \
    --namespace databend-query --create-namespace \
    --values values.yaml
❯ kubectl -n databend-query get pods
NAME                                      READY   STATUS    RESTARTS   AGE
tenant1-databend-query-66647594c-lkkm9    1/1     Running   0          55m
tenant1-databend-query-66647594c-lpl2s    1/1     Running   0          55m
tenant1-databend-query-66647594c-4hlpw    1/1     Running   0          55m
tenant2-databend-query-59dcc4949f-9qg9b   1/1     Running   0          53s
tenant2-databend-query-59dcc4949f-pfxxj   1/1     Running   0          53s
tenant2-databend-query-59dcc4949f-mmwr9   1/1     Running   0          53s
Maintain Databend Query Cluster
Scale
to scale up or down the query cluster, there are two ways
directly use
kubectl# scale query cluster number to 0
kubectl -n databend-query scale statefulset tenant1-databend-query --replicas=0
# scale query cluster number to 5
kubectl -n databend-query scale statefulset tenant1-databend-query --replicas=5update
replicaCountinvalues.yamlto any value, then helm upgrade againdiff values.yaml- replicaCount: 3
+ replicaCount: 5helm upgrade --install tenant1 databend/databend-query \
--namespace databend-query --create-namespace \
--values values.yaml
Upgrade
to upgrade the query cluster, we need to modify the values.yaml for query cluster above.
replicaCount: 3
+ image:
+ tag: "v0.8.123-nightly"
config:
query:
clusterId: example_cluster
then just run again helm upgrade
# optional
helm repo update databend
helm upgrade --install tenant1 databend/databend-query \
    --namespace databend-query --create-namespace \
    --values values.yaml
Check the Cluster Information
❯ select * from system.clusters;
+------------------------+------------+------+------------------------------------------------------------------------------+
| name                   | host       | port | version                                                                      |
+------------------------+------------+------+------------------------------------------------------------------------------+
| TJoPIFqvwU6l6IuZzwVmj  | 10.42.0.29 | 9090 | v0.8.122-nightly-5d3a308(rust-1.67.0-nightly-2022-11-20T16:27:23.284298522Z) |
| e7leCg352OPa7bIBTi3ZK  | 10.42.0.30 | 9090 | v0.8.122-nightly-5d3a308(rust-1.67.0-nightly-2022-11-20T16:27:23.284298522Z) |
| uGD38DVaWDAnJV5jupK4p4 | 10.42.0.28 | 9090 | v0.8.122-nightly-5d3a308(rust-1.67.0-nightly-2022-11-20T16:27:23.284298522Z) |
+------------------------+------------+------+------------------------------------------------------------------------------+
3 rows in set (0.009 sec)
Verify Distributed Query Working
❯ EXPLAIN SELECT max(number), sum(number) FROM numbers_mt(10000000000) GROUP BY number % 3, number % 4, number % 5 LIMIT 10;
+-------------------------------------------------------------------------------------------------------------------------------------------+
| explain                                                                                                                                   |
+-------------------------------------------------------------------------------------------------------------------------------------------+
| Limit                                                                                                                                     |
| ├── limit: 10                                                                                                                       |
| ├── offset: 0                                                                                                                       |
| └── Exchange                                                                                                                        |
|     ├── exchange type: Merge                                                                                                        |
|     └── EvalScalar                                                                                                                  |
|         ├── expressions: [max(number) (#6), sum(number) (#7)]                                                                       |
|         └── AggregateFinal                                                                                                          |
|             ├── group by: [number % 3, number % 4, number % 5]                                                                      |
|             ├── aggregate functions: [max(number), sum(number)]                                                                     |
|             └── Exchange                                                                                                            |
|                 ├── exchange type: Hash(_group_by_key)                                                                              |
|                 └── AggregatePartial                                                                                                |
|                     ├── group by: [number % 3, number % 4, number % 5]                                                              |
|                     ├── aggregate functions: [max(number), sum(number)]                                                             |
|                     └── EvalScalar                                                                                                  |
|                         ├── expressions: [%(numbers_mt.number (#0), 3), %(numbers_mt.number (#0), 4), %(numbers_mt.number (#0), 5)] |
|                         └── TableScan                                                                                               |
|                             ├── table: default.system.numbers_mt                                                                    |
|                             ├── read rows: 10000000000                                                                              |
|                             ├── read bytes: 80000000000                                                                             |
|                             ├── partitions total: 152588                                                                            |
|                             ├── partitions scanned: 152588                                                                          |
|                             └── push downs: [filters: [], limit: NONE]                                                              |
+-------------------------------------------------------------------------------------------------------------------------------------------+
24 rows in set (0.008 sec)
The distributed query works, and the cluster will efficiently transfer data through flight_api_address.
Upload Data to the Cluster
CREATE TABLE t1(i INT, j INT);
INSERT INTO t1 SELECT number, number + 300 from numbers(10000000);
SELECT count(*) FROM t1;
+----------+
| count()  |
+----------+
| 10000000 |
+----------+
Monitoring the Meta and Query cluster
Note the serviceMonitor should be enabled when deploying meta and query cluster.
Download the grafana dashboard files from: datafuselabs/helm-charts.
Open grafana web for your cluster.
Select
+on the upper right corner to expand the menu, click on "Import dashboard" to import the dashboard, and upload the two downloaded JSON files.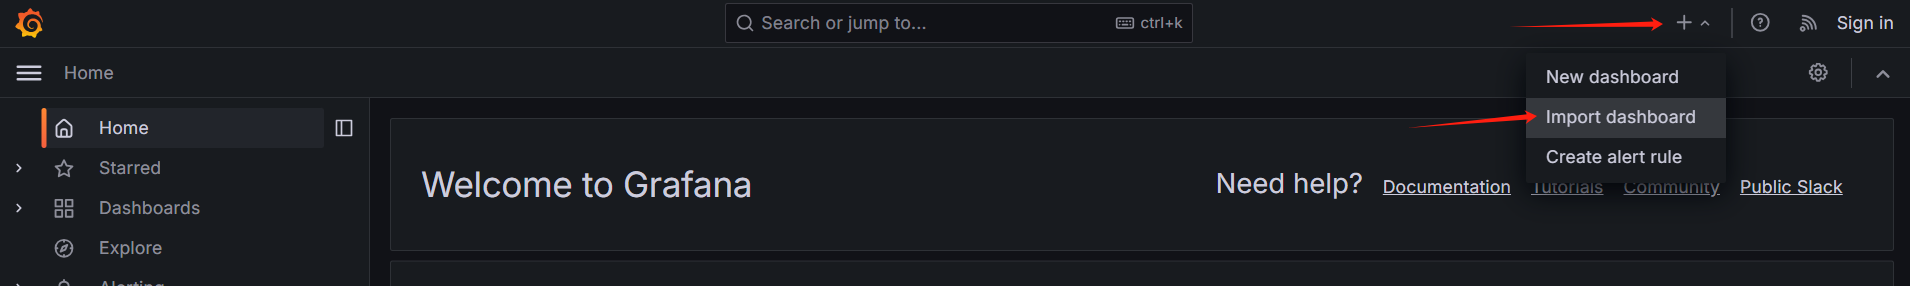
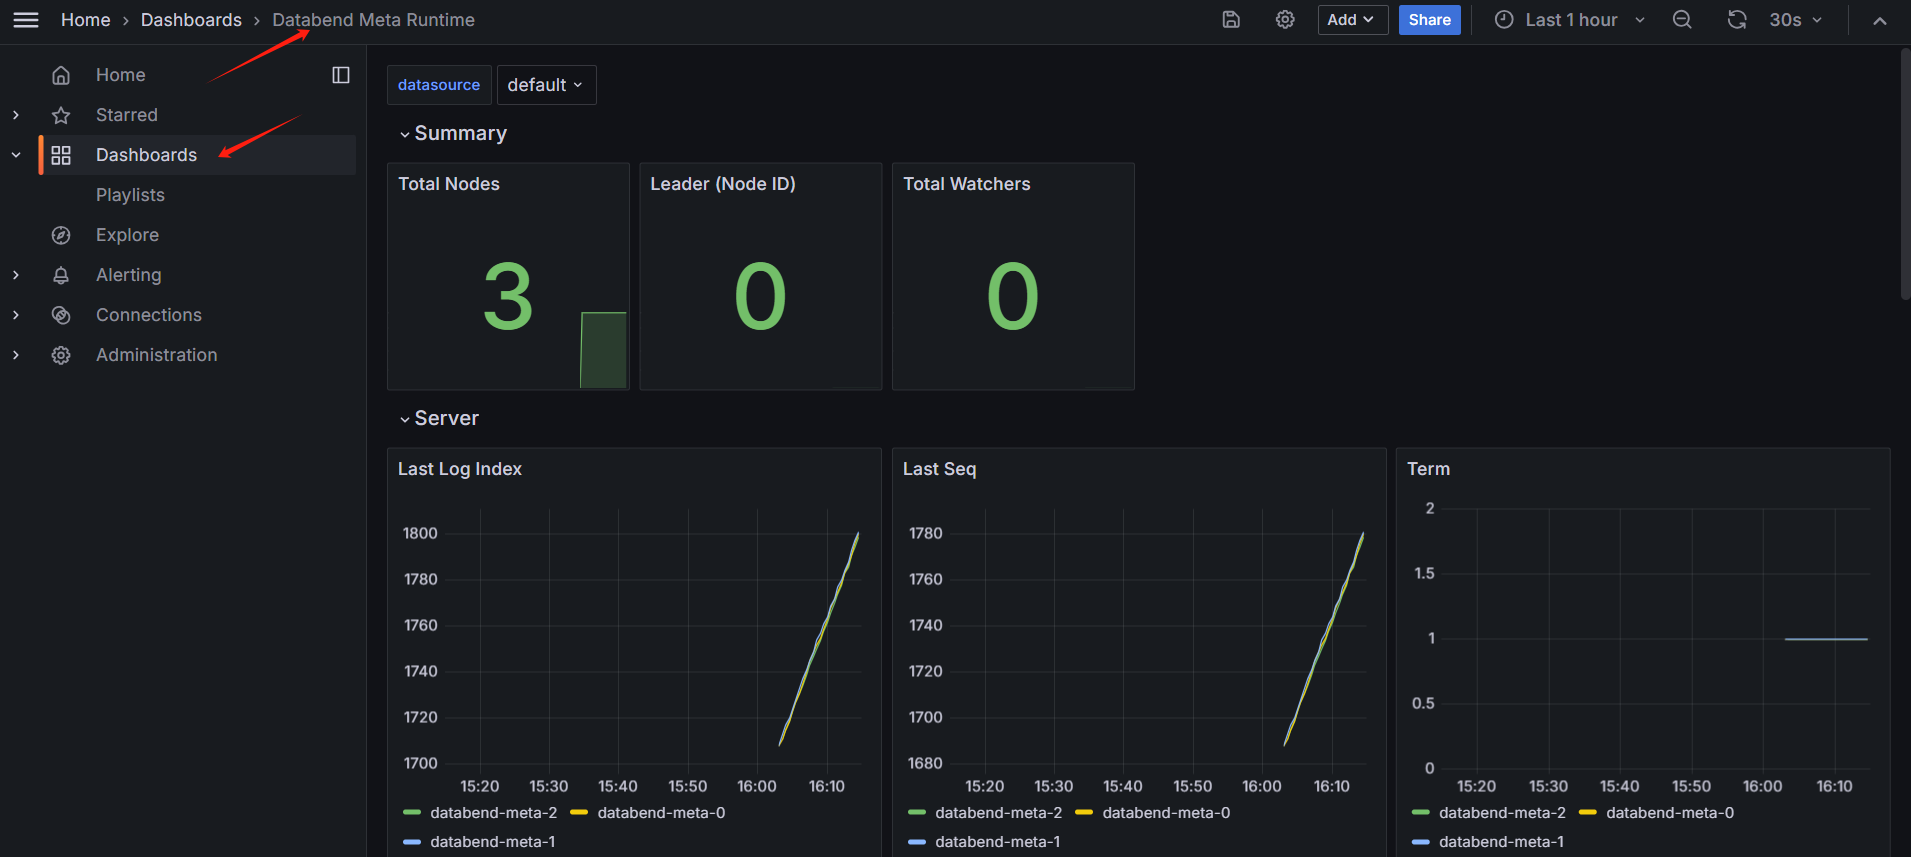
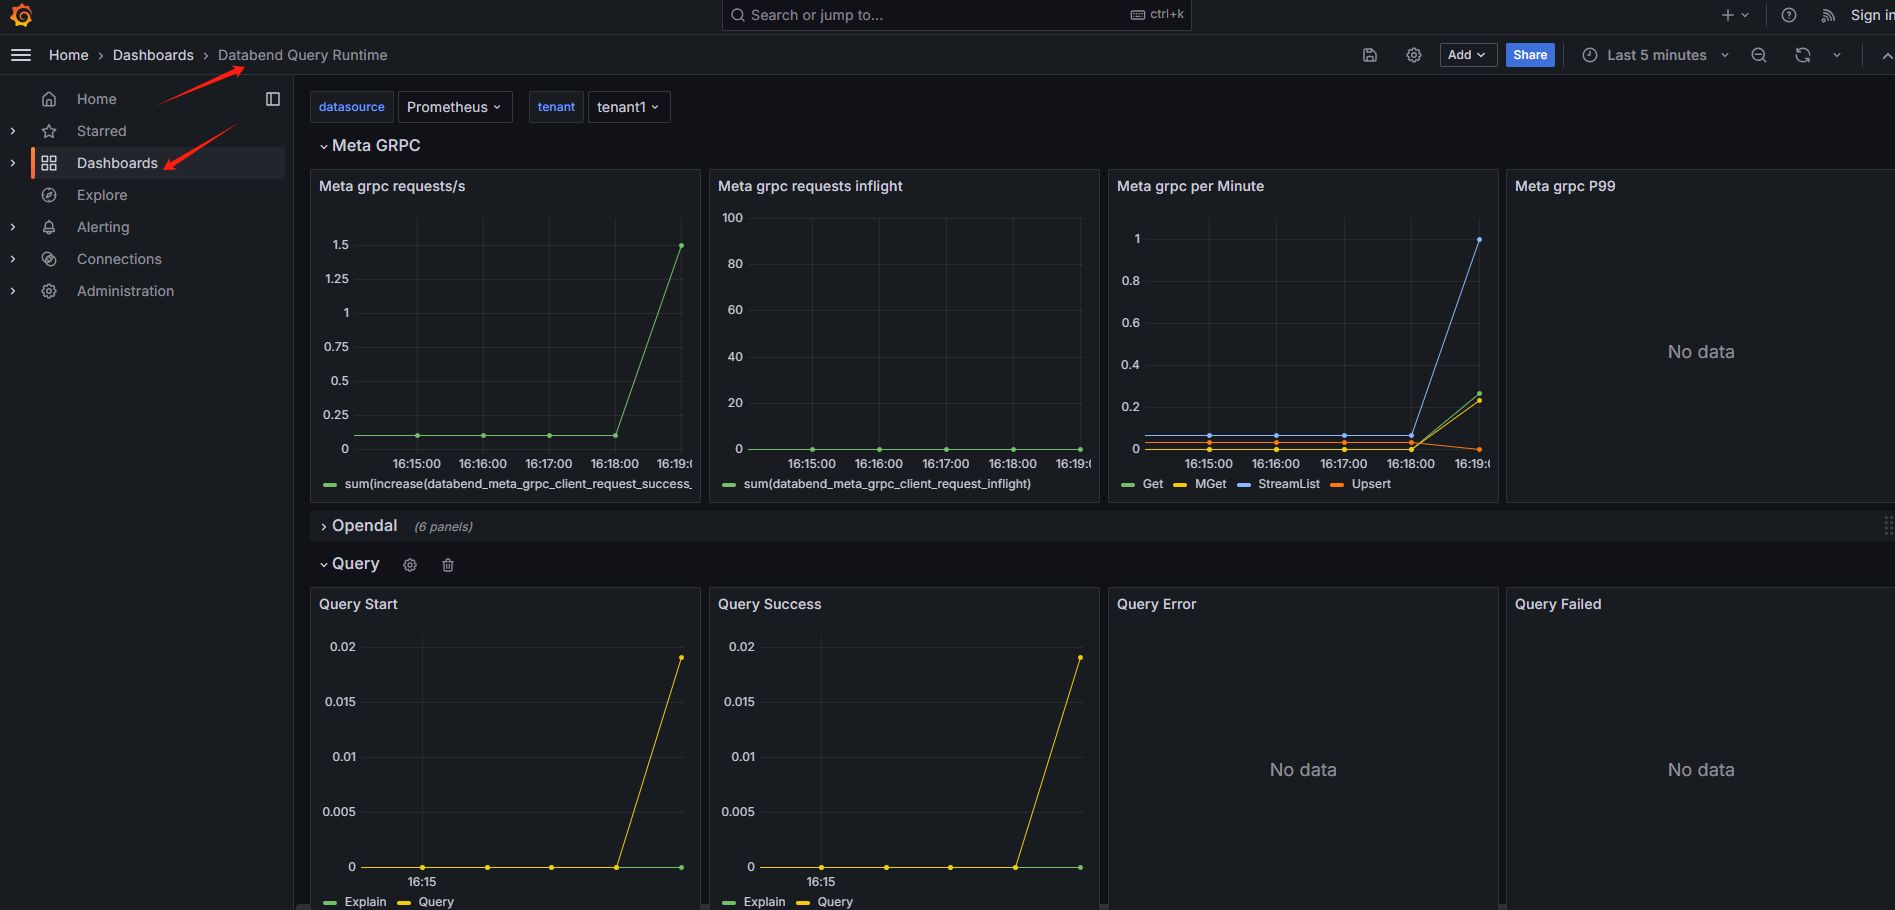
Then you should see the two dashboard:
Databend Meta Runtime
Databend Query Runtime
Next Steps
After deploying Databend, you might need to learn about the following topics:
- Load & Unload Data: Manage data import/export in Databend.
- Visualize: Integrate Databend with visualization tools for insights.