EXPLAIN ANALYZE GRAPHICAL
Introduced or updated: v1.2.647
Analyzes query performance with an interactive visual representation in your browser. Available exclusively in BendSQL v0.22.2+.
Syntax
EXPLAIN ANALYZE GRAPHICAL <statement>
Configuration
Add to your BendSQL config file ~/.config/bendsql/config.toml:
[server]
bind_address = "127.0.0.1"
auto_open_browser = true
Example
EXPLAIN ANALYZE GRAPHICAL SELECT l_returnflag, COUNT(*)
FROM lineitem
WHERE l_shipdate <= '1998-09-01'
GROUP BY l_returnflag;
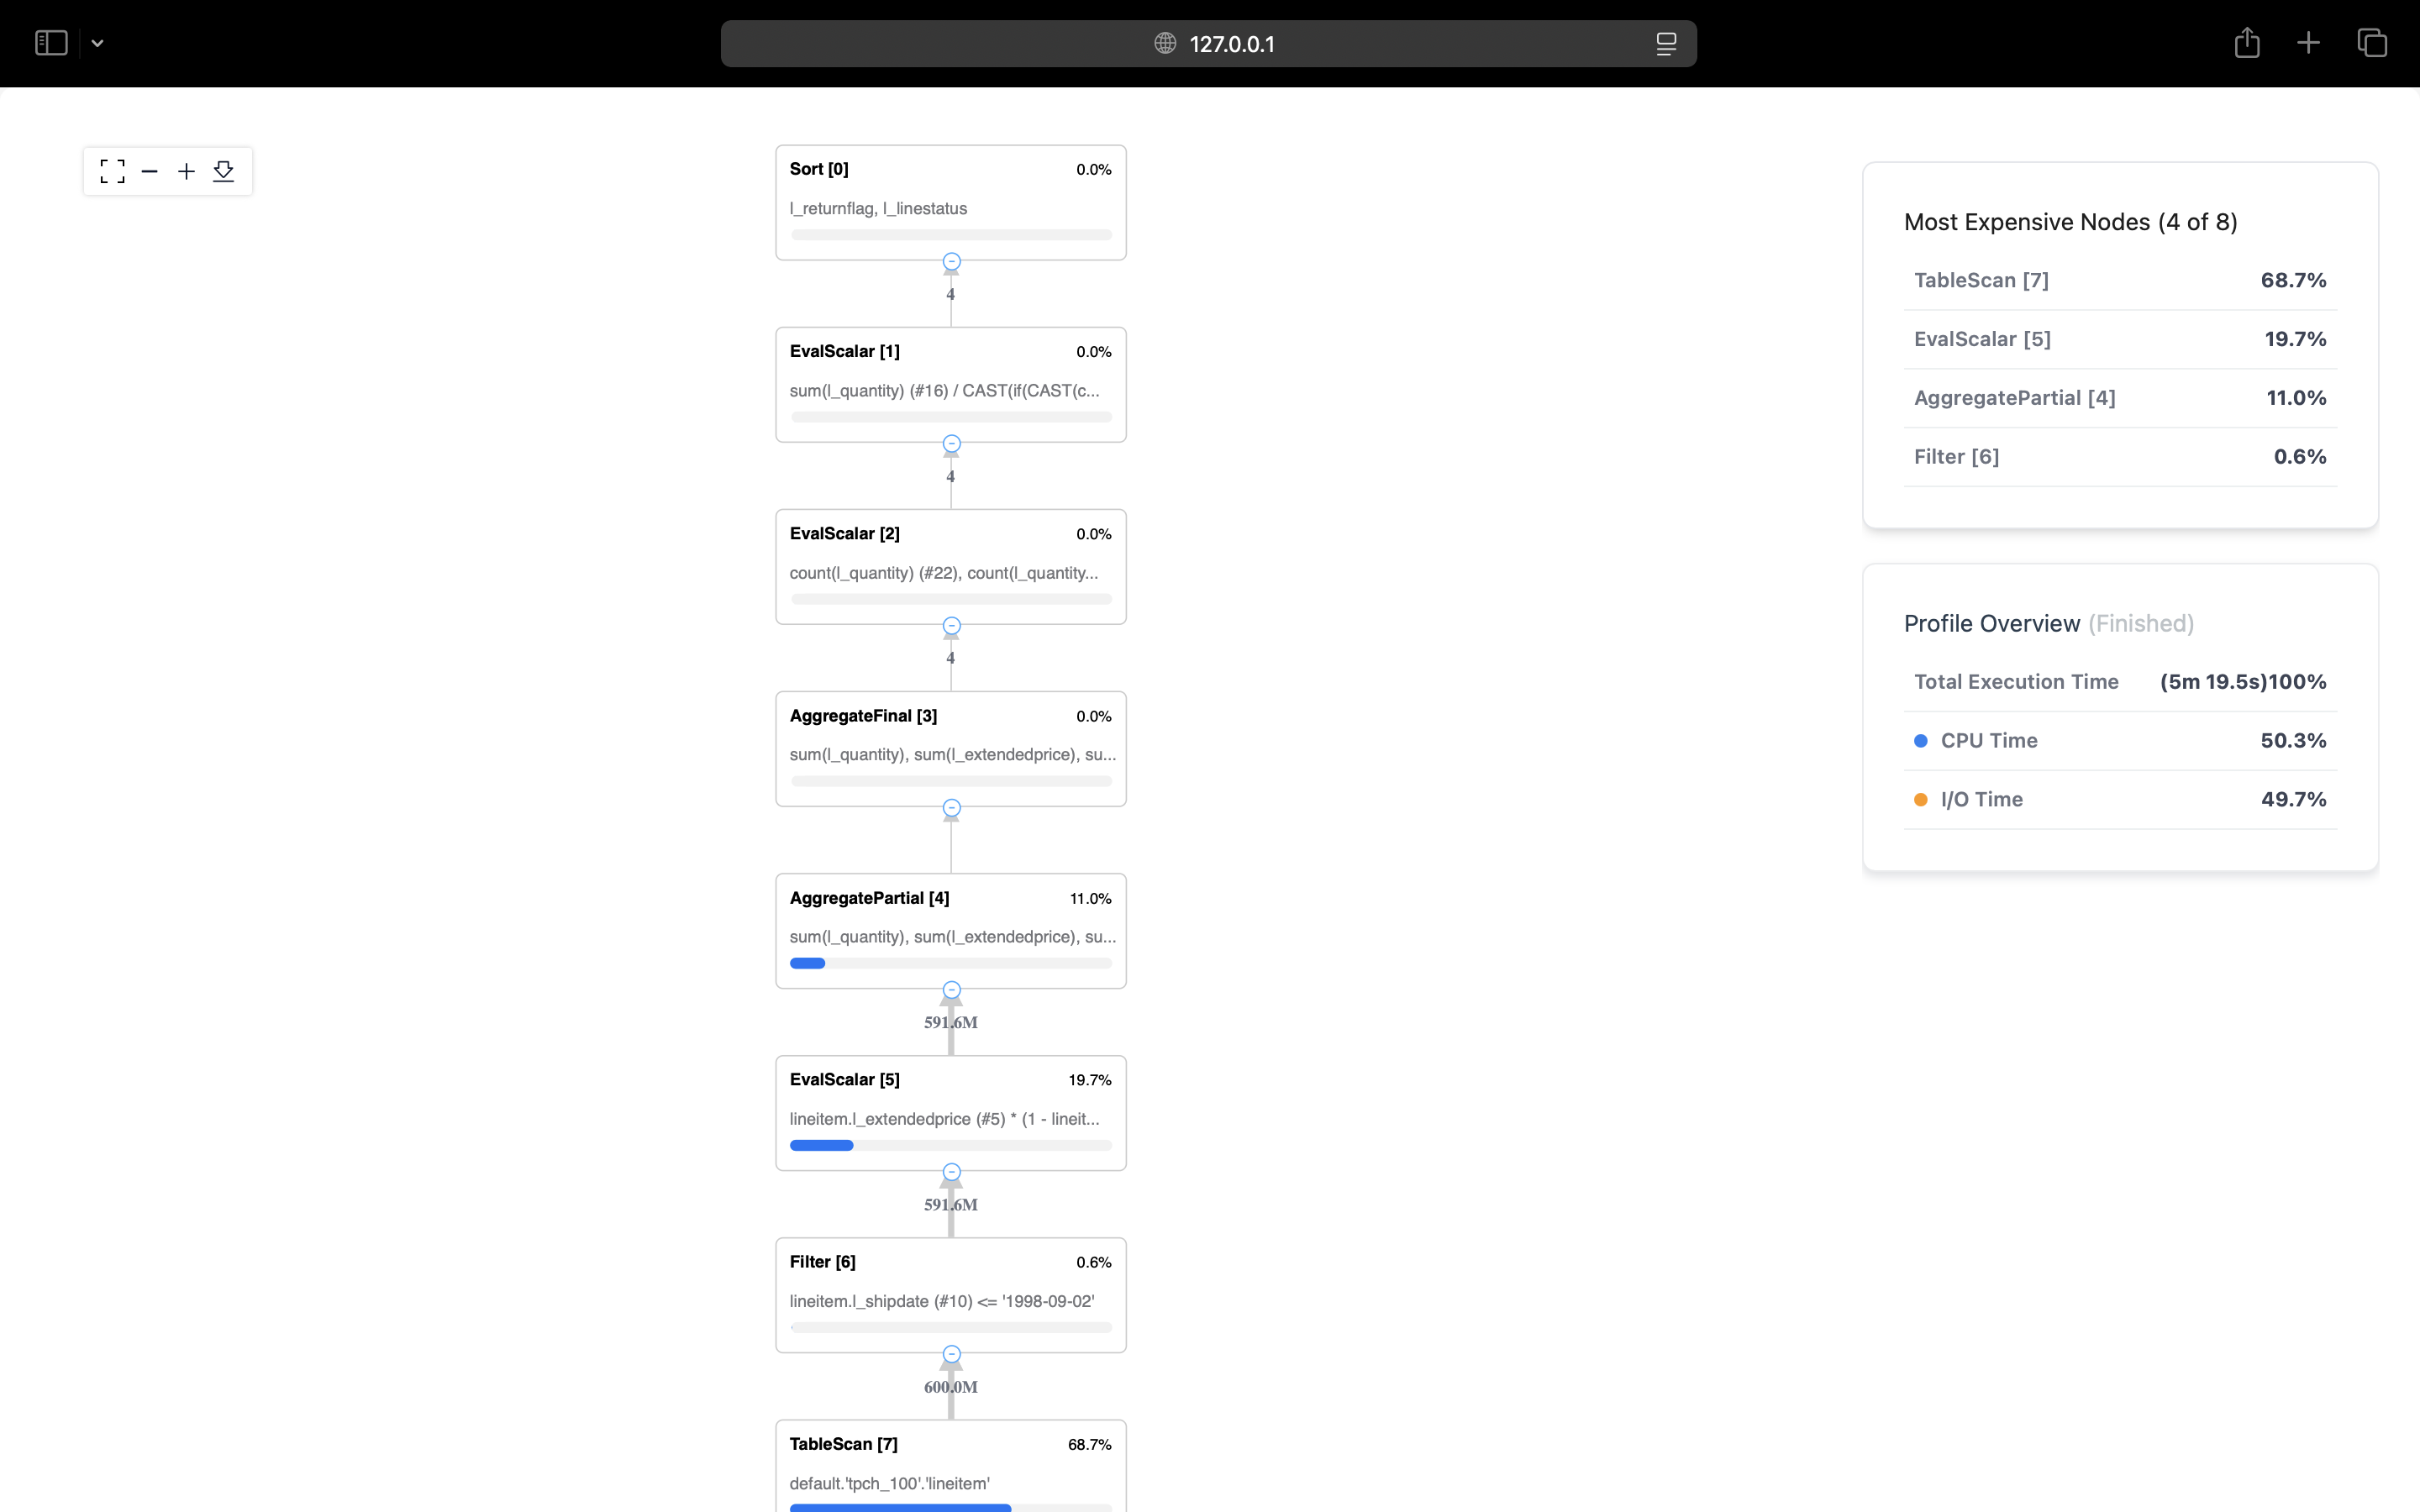
Output:
View graphical online: http://127.0.0.1:8080?perf_id=1
Opens an interactive view showing execution plan, operator runtimes, and data flow.