Grafana
Grafana is a monitoring dashboard system, which is an open-source monitoring tool developed by Grafana Labs. It can greatly simplify the complexity of monitoring by allowing us to provide the data to be monitored, and it generates various visualizations. Additionally, it has an alarm function that sends notifications when there is an issue with the system.
Databend Cloud and Databend can integrate with Grafana in two ways:
- Databend Data Source Plugin (Recommended): Use the Grafana Databend Data Source Plugin for direct SQL access, with a query builder, metrics, logs, traces, alerting, and annotations. Works with both self-hosted Databend and Databend Cloud.
- Loki Protocol: Use Grafana's built-in Loki data source to connect to Databend Cloud via Loki-compatible API endpoints.
Using the Databend Data Source Plugin (Recommended)
The Grafana Databend Data Source Plugin provides direct SQL access to Databend and includes:
- SQL Editor — Full SQL query editor with macro support and template variables
- Query Builder — Visual query builder with database/table/column selectors, filters, aggregation, and ordering
- Metrics — Time series visualization with the
$__timeIntervalmacro - Logs — Native logs support with configurable time/level/message columns
- Traces — Native traces support with configurable span/trace ID columns
- Alerting — Grafana alerting support
- Annotations — Query-based annotations
Step 1. Set up Environment
Before you start, ensure you have:
- Grafana installed. Refer to the official installation guide: https://grafana.com/docs/grafana/latest/setup-grafana/installation
- Either:
- A local Databend instance (follow the Deployment Guide to deploy)
- Or Databend Cloud access with connection information for a warehouse (see Connecting to a Warehouse)
Step 2. Modify Grafana Configuration
The plugin is not yet signed, so you need to allow Grafana to load it. Add the following lines to your grafana.ini file:
[plugins]
allow_loading_unsigned_plugins = databendlabs-databend-datasource
Alternatively, set it via environment variable:
GF_PLUGINS_ALLOW_LOADING_UNSIGNED_PLUGINS=databendlabs-databend-datasource
Step 3. Install the Grafana Databend Data Source Plugin
-
Find the latest release on the Releases page.
-
Download the plugin archive and extract it into your Grafana plugins directory. For example, using release
v1.4.9:
curl -fLo /tmp/grafana-databend-datasource.zip https://github.com/databendlabs/grafana-databend-datasource/releases/download/v1.4.9/databendlabs-databend-datasource-1.4.9.zip
unzip /tmp/grafana-databend-datasource.zip -d /var/lib/grafana/plugins
rm /tmp/grafana-databend-datasource.zip
When running Grafana in Docker, mount the plugin and set the environment variable instead:
services:
  grafana:
    image: grafana/grafana:latest
    environment:
      - GF_PLUGINS_ALLOW_LOADING_UNSIGNED_PLUGINS=databendlabs-databend-datasource
    volumes:
      - ./databendlabs-databend-datasource:/var/lib/grafana/plugins/databendlabs-databend-datasource
-
Restart Grafana to load the plugin.
-
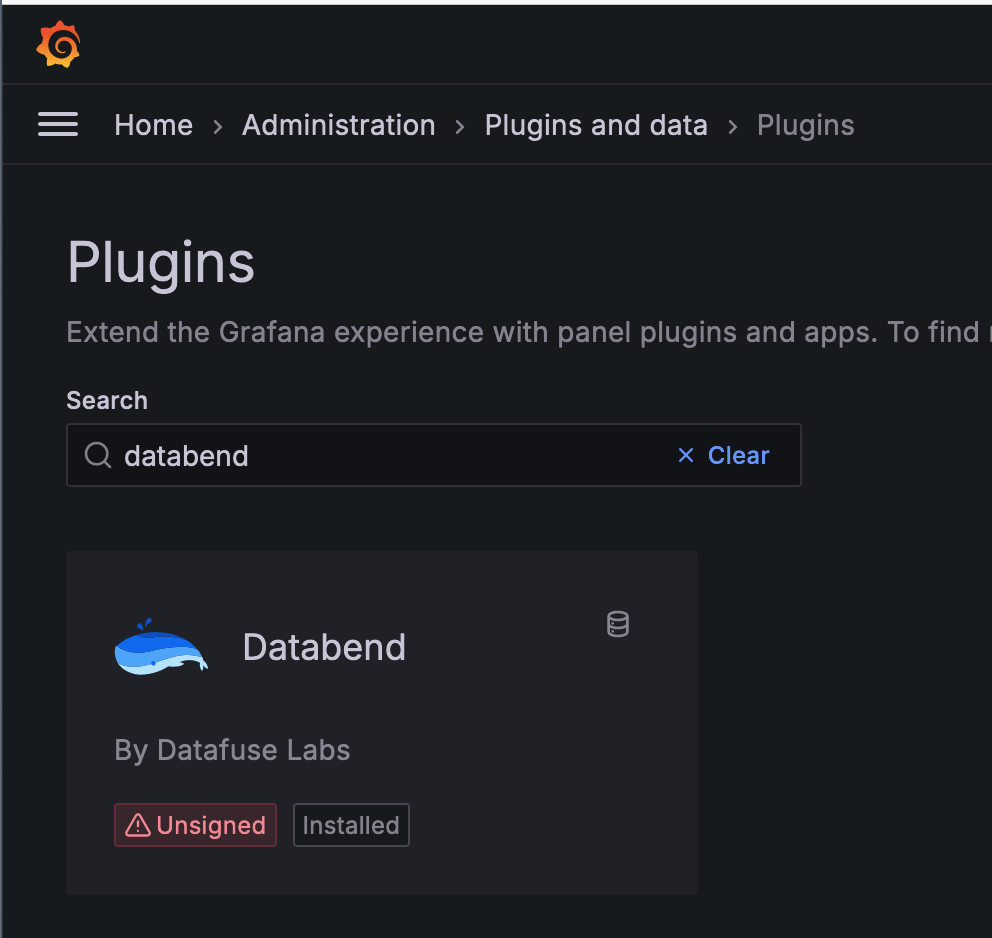
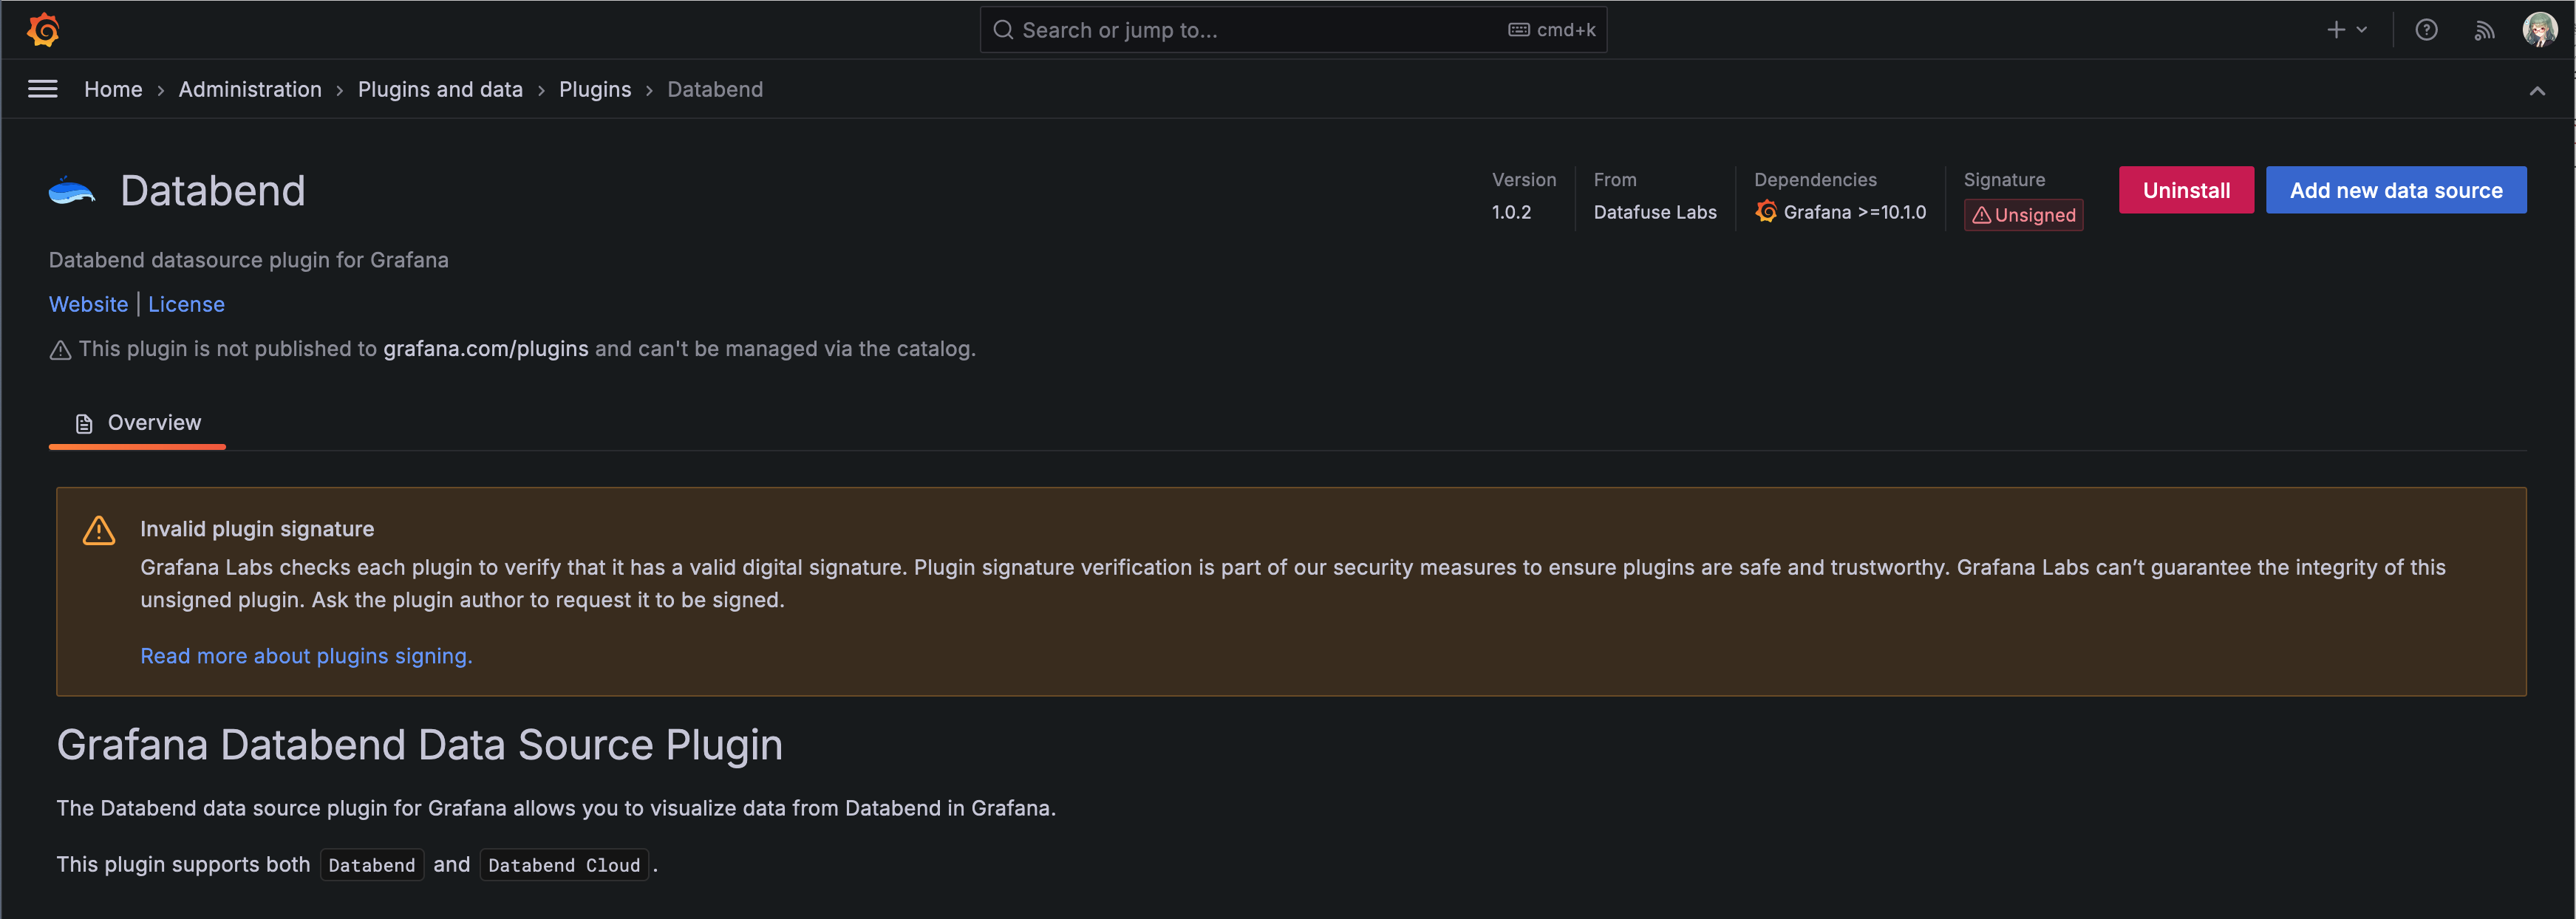
Navigate to the Plugins page in the Grafana UI, for example,
http://localhost:3000/plugins, and ensure the plugin is installed.
Step 4. Configure Data Source
-
Go to the
Add new connectionpage, for example,http://localhost:3000/connections/add-new-connection?search=databend, search fordatabend, and select it. -
Click Add new data source on the top right corner of the page.
-
Input the
DSNfield for your Databend instance. For example:- Self-hosted:
databend://root:@localhost:8000/default?sslmode=disable - Databend Cloud:
databend://cloudapp:******@tnxxxxxxx.gw.aws-us-east-2.default.databend.com:443/default?warehouse=xsmall-fsta
- Self-hosted:
-
Optionally, input the
SQL User Passwordfield to override the password in theDSNfield. -
Click Save & test. If the page displays "Data source is working", the data source has been successfully created.
Step 5. Test Queries
-
Create a new dashboard and add a panel.
-
Select your Databend data source.
-
Write SQL queries using the SQL editor, or use the visual query builder to retrieve and visualize your data. The plugin supports macros such as
$__timeFilter(col)and$__timeInterval(col)for time-based queries — see the plugin README for the full list. -
Configure the panel visualization options as needed.
Using Loki Protocol (Alternative)
Databend Cloud provides a Loki-compatible API that allows you to use Grafana's native Loki data source without installing additional plugins. This is a good option when you only need log visualization via LogQL.
The Loki protocol feature requires activation. Please contact support to enable this feature for your account.
Step 1. Configure Table
Before connecting to Grafana, configure your Databend Cloud table for log data visualization. Below are two recommended schema types:
Loki Schema
This schema stores labels as a VARIANT/MAP alongside the log body:
CREATE TABLE logs (
  `timestamp` TIMESTAMP NOT NULL,
  `labels` VARIANT NOT NULL,
  `line` STRING NOT NULL,
  `stream_hash` UInt64 NOT NULL AS (city64withseed(labels, 0)) STORED
) CLUSTER BY (to_start_of_hour(timestamp), stream_hash);

CREATE INVERTED INDEX logs_line_idx ON logs(line);
REFRESH INVERTED INDEX logs_line_idx ON logs;
timestamp: log event timestamplabels: VARIANT storing serialized Loki labelsline: raw log linestream_hash: computed hash for clustering
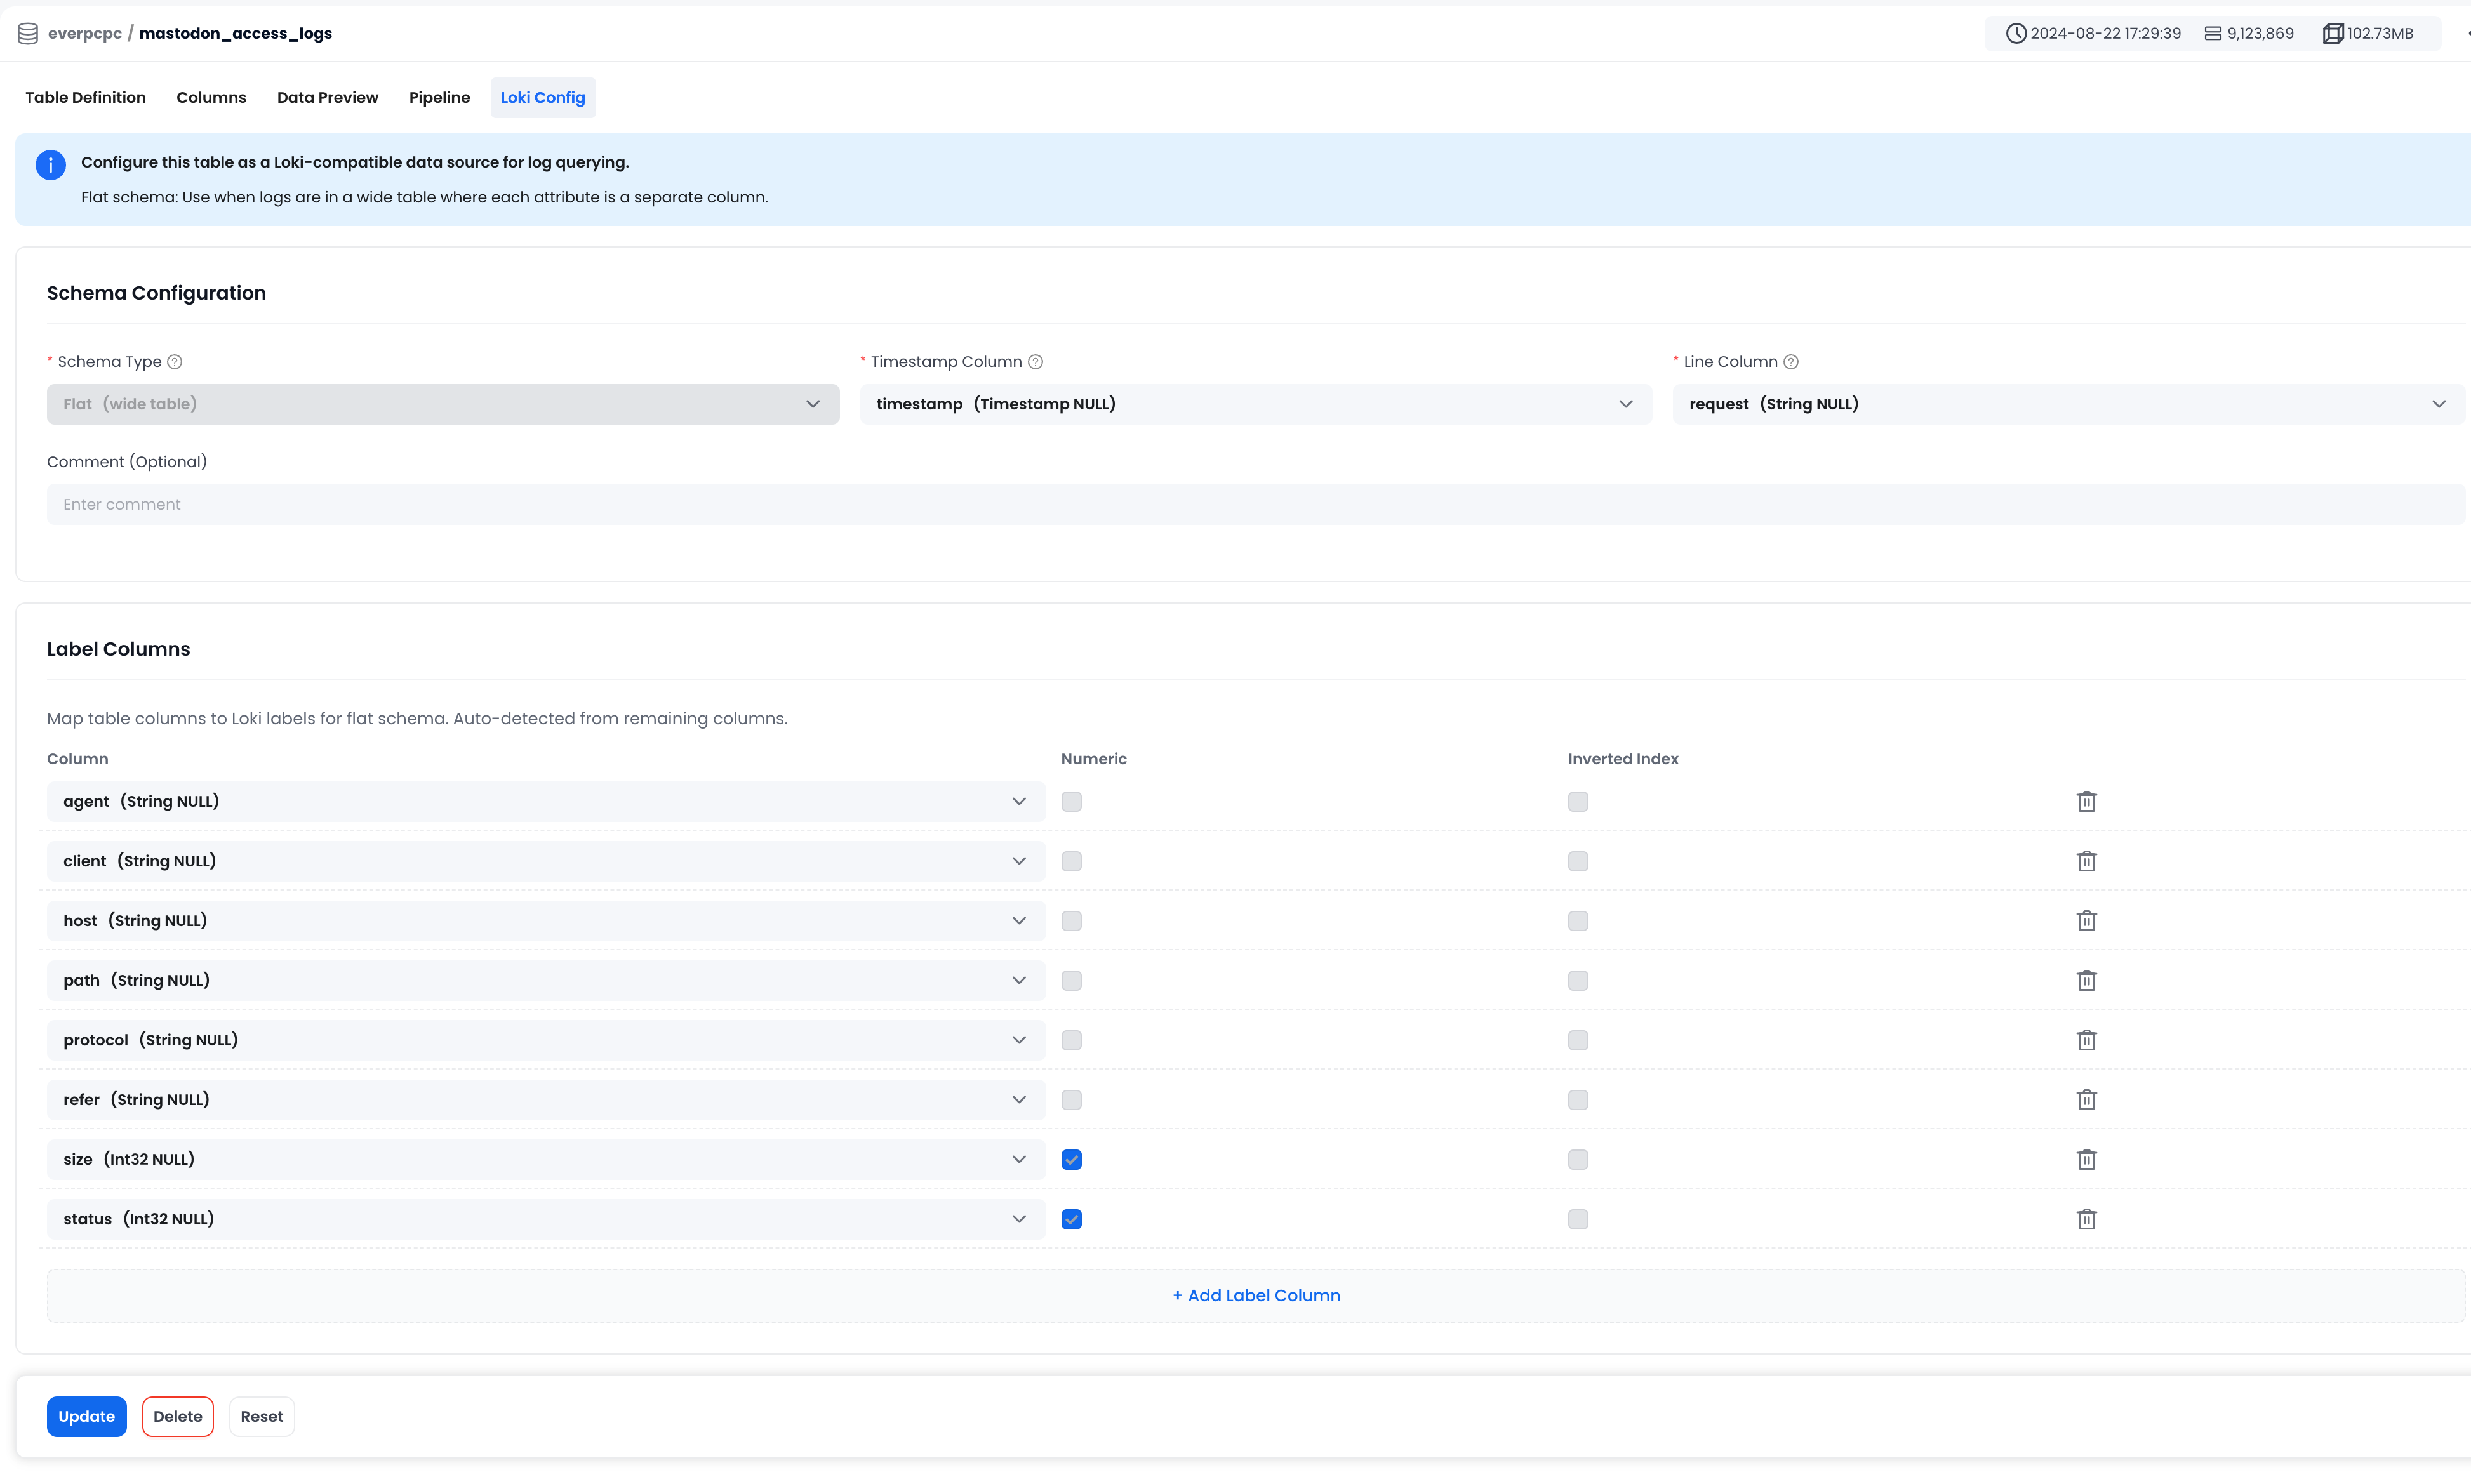
Flat Schema
This schema uses a wide table where each attribute is a separate column:
CREATE TABLE nginx_logs (
  `agent` STRING,
  `client` STRING,
  `host` STRING,
  `path` STRING,
  `request` STRING,
  `status` INT,
  `timestamp` TIMESTAMP NOT NULL
) CLUSTER BY (to_start_of_hour(timestamp), host, status);

CREATE INVERTED INDEX nginx_request_idx ON nginx_logs(request);
REFRESH INVERTED INDEX nginx_request_idx ON nginx_logs;
Every column except the timestamp and line column becomes a LogQL label.
Step 2. Get Connection Information
-
Log in to your Databend Cloud account.
-
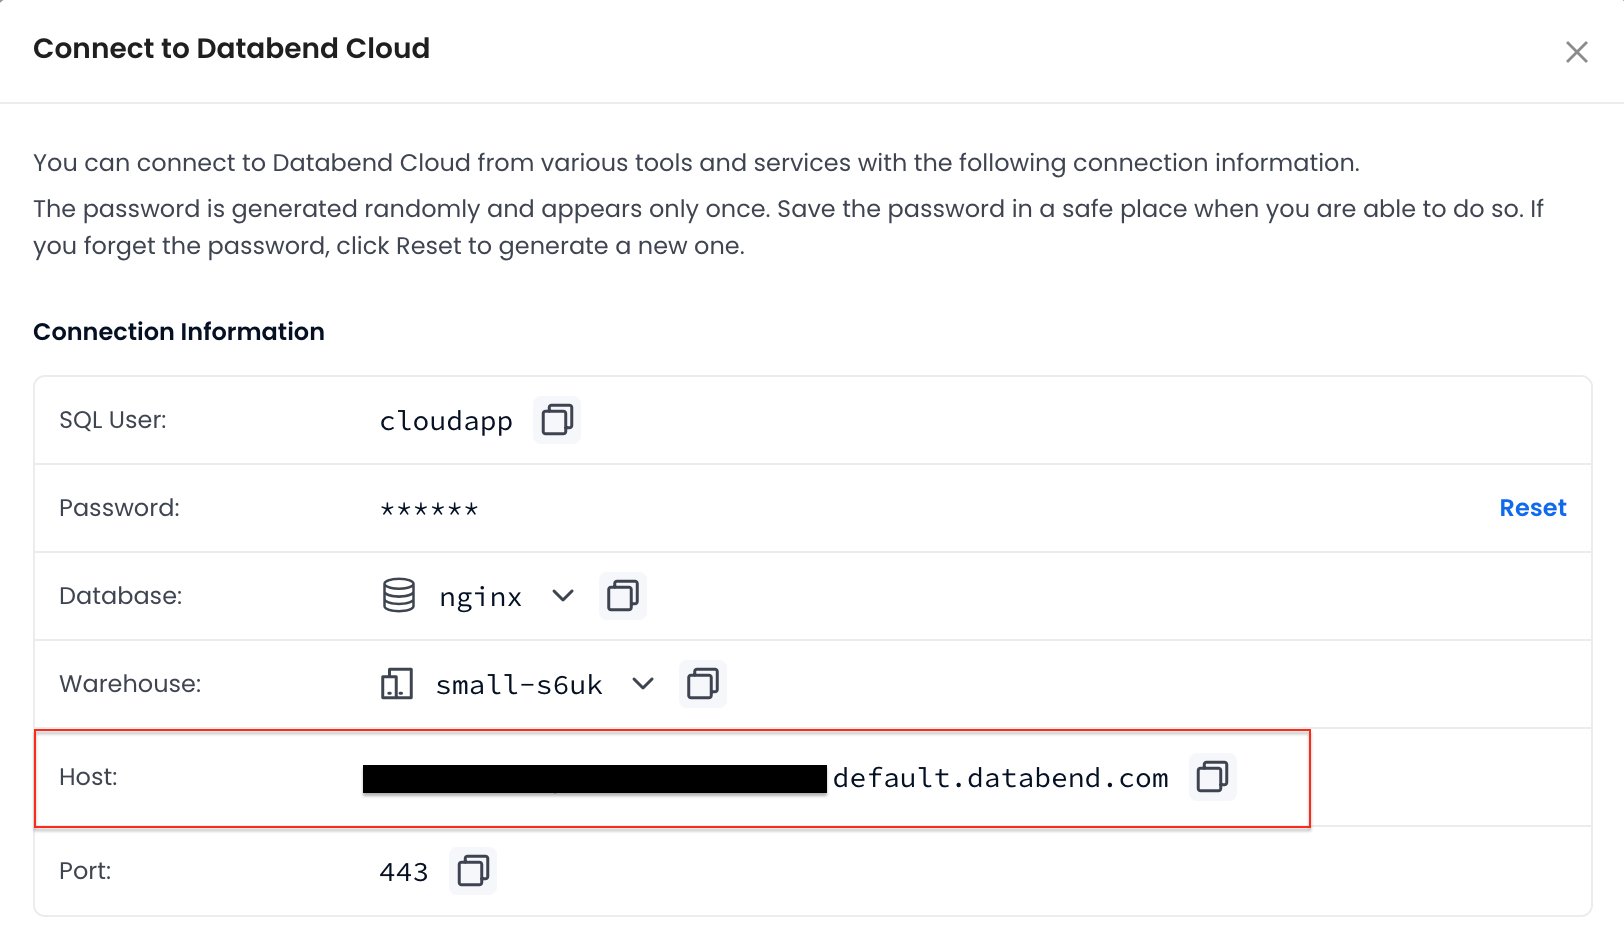
On the dashboard, click Connect to view the connection information. Note down:
- Host: The warehouse endpoint (e.g.,
tnxxxxxxx.gw.aws-us-east-2.default.databend.com) - User: Your username (typically
cloudapp) - Password: Your password or API key
- Database: The database name containing your log table
- Warehouse: The warehouse name
- Host: The warehouse endpoint (e.g.,
For detailed information on obtaining connection details, see Connecting to a Warehouse.
Step 3. Configure Grafana Data Source
-
In Grafana, navigate to Connections > Data sources > Add data source.
-
Search for and select Loki.
-
Configure the basic settings:
- Name: Give your data source a descriptive name (e.g., "Databend Cloud Logs")
- URL: Enter
https://<host>using the host from Step 2
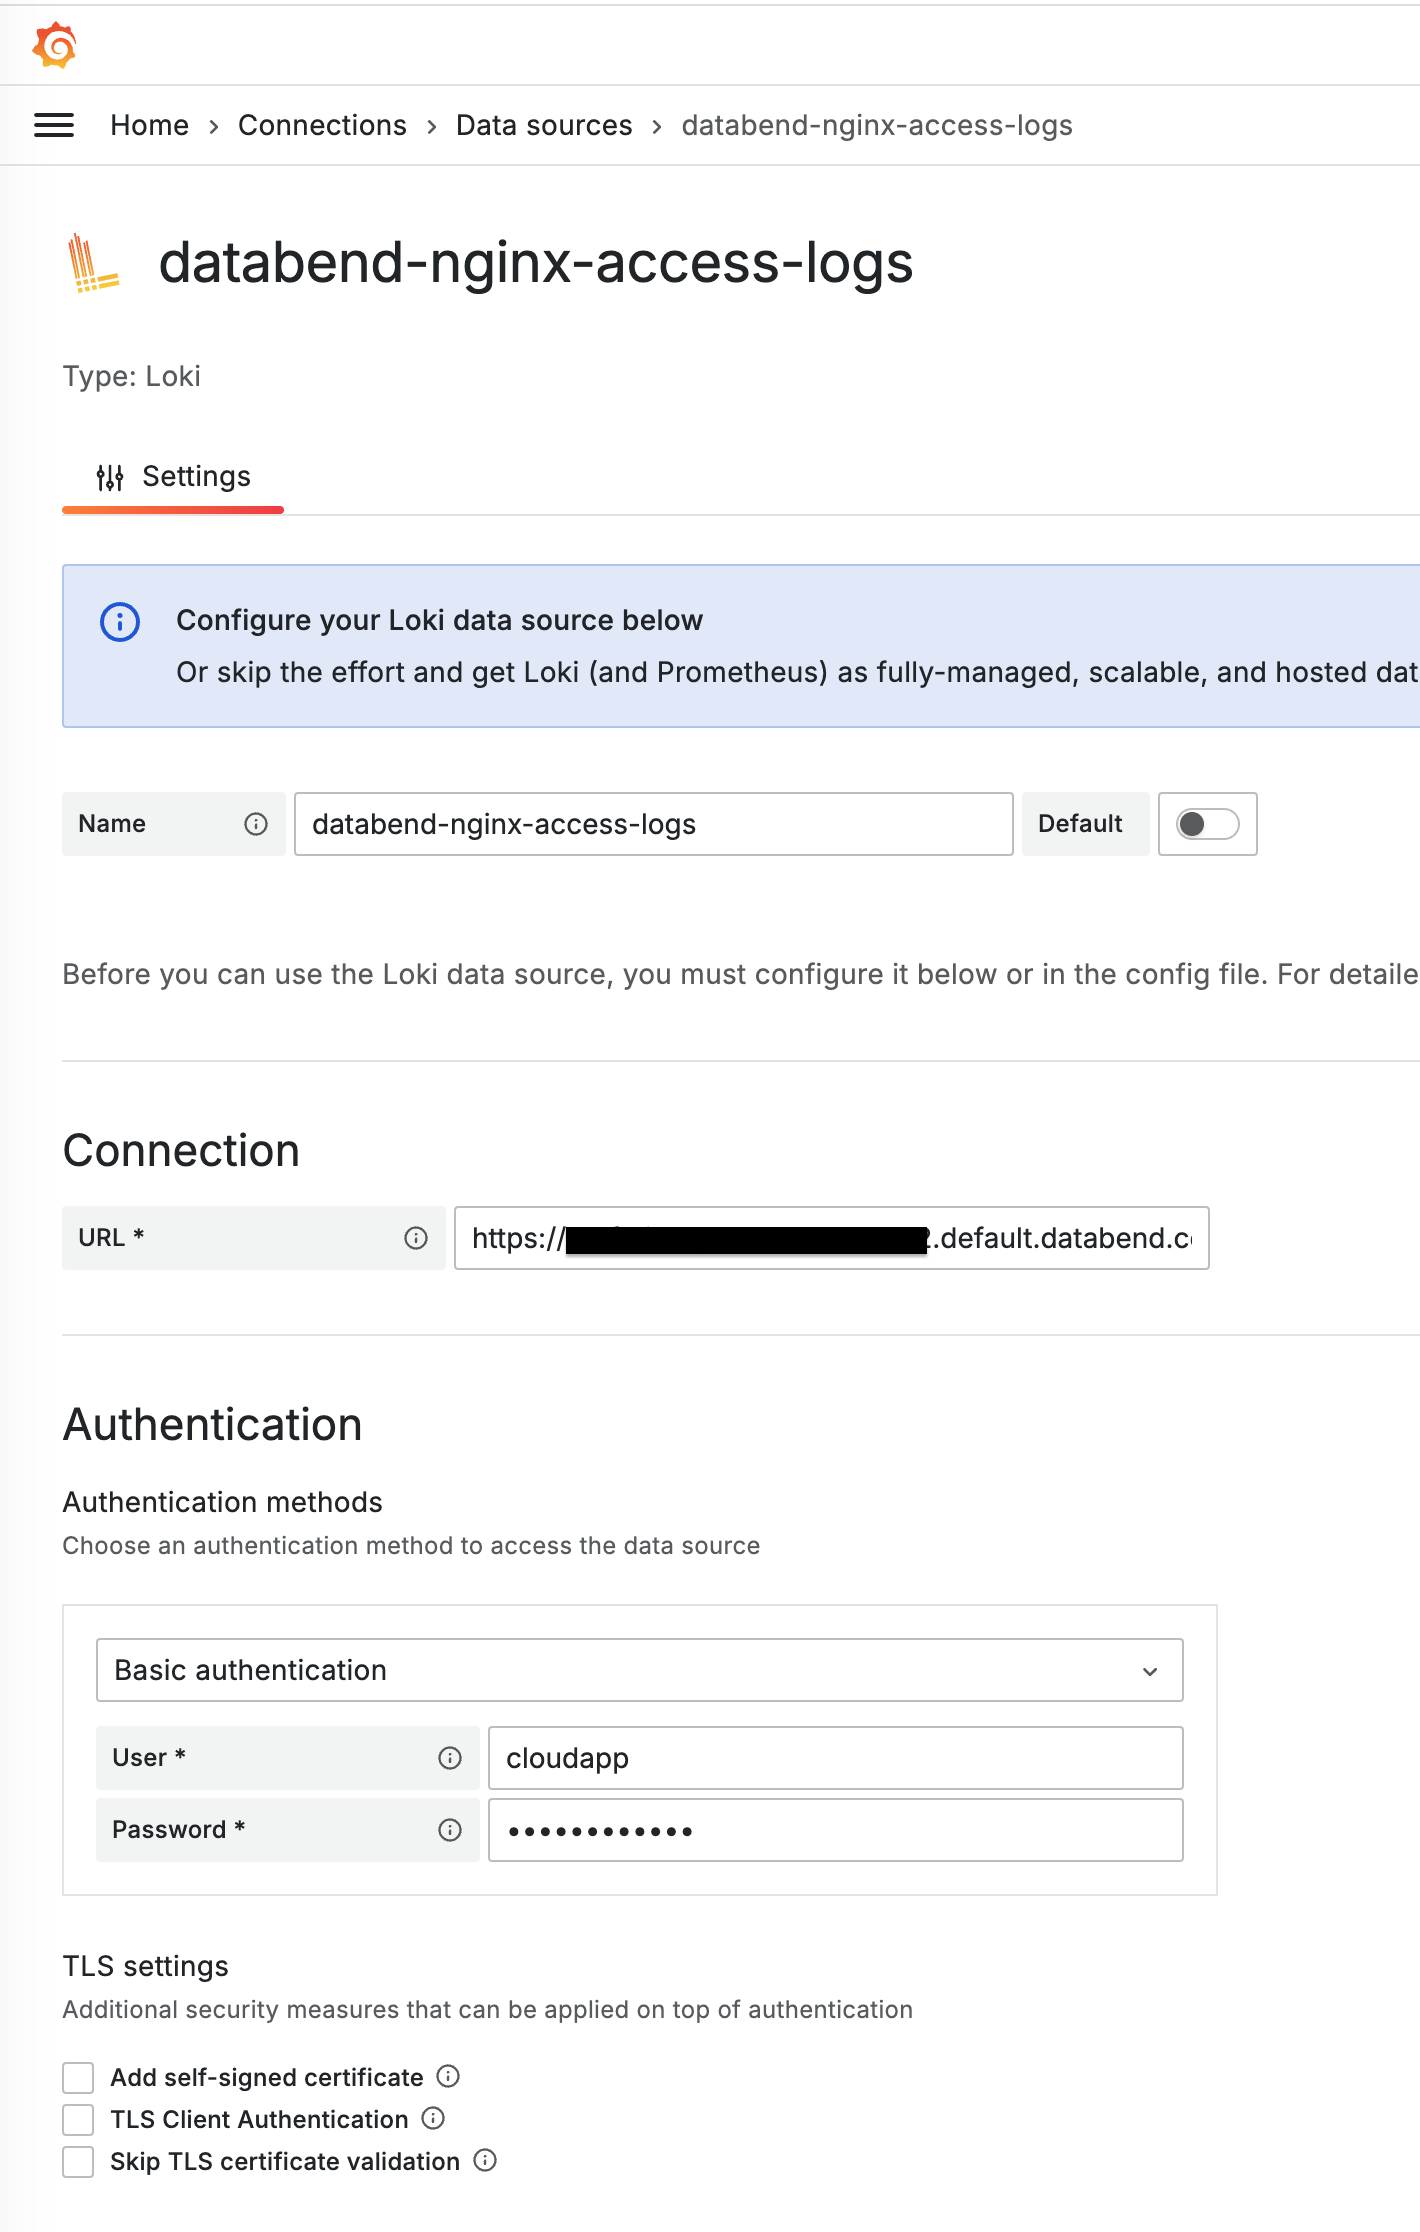
-
Configure authentication:
- Enable Basic auth under the Authentication section
- User: Enter your username (typically
cloudapp) - Password: Enter your password or API key
-
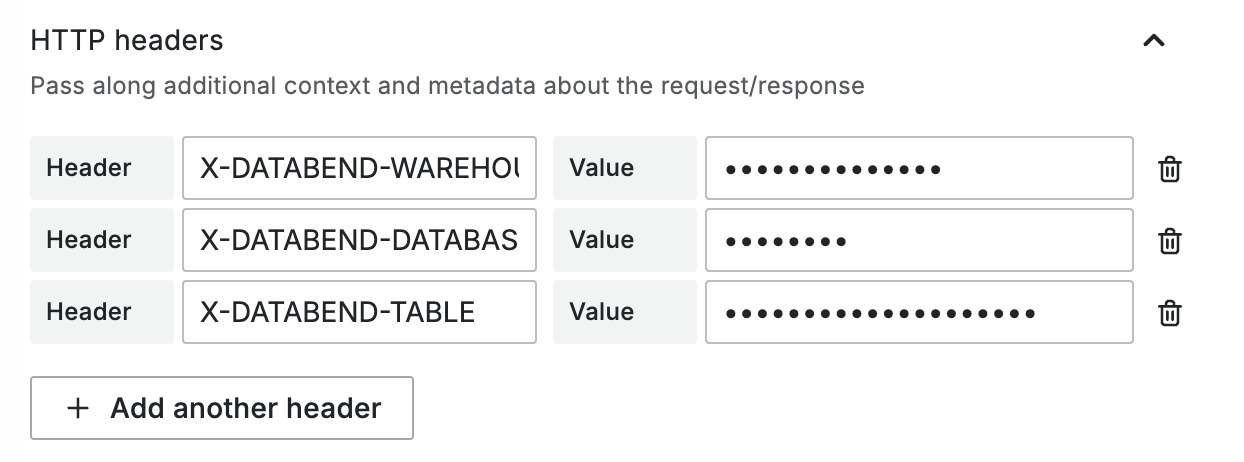
Add custom HTTP headers. Under Custom HTTP Headers, add the following:
- Header:
X-Databend-Warehouse, Value: Your warehouse name - Header:
X-Databend-Database, Value: Your database name - Header:
X-Databend-Table, Value: Your table name
- Header:
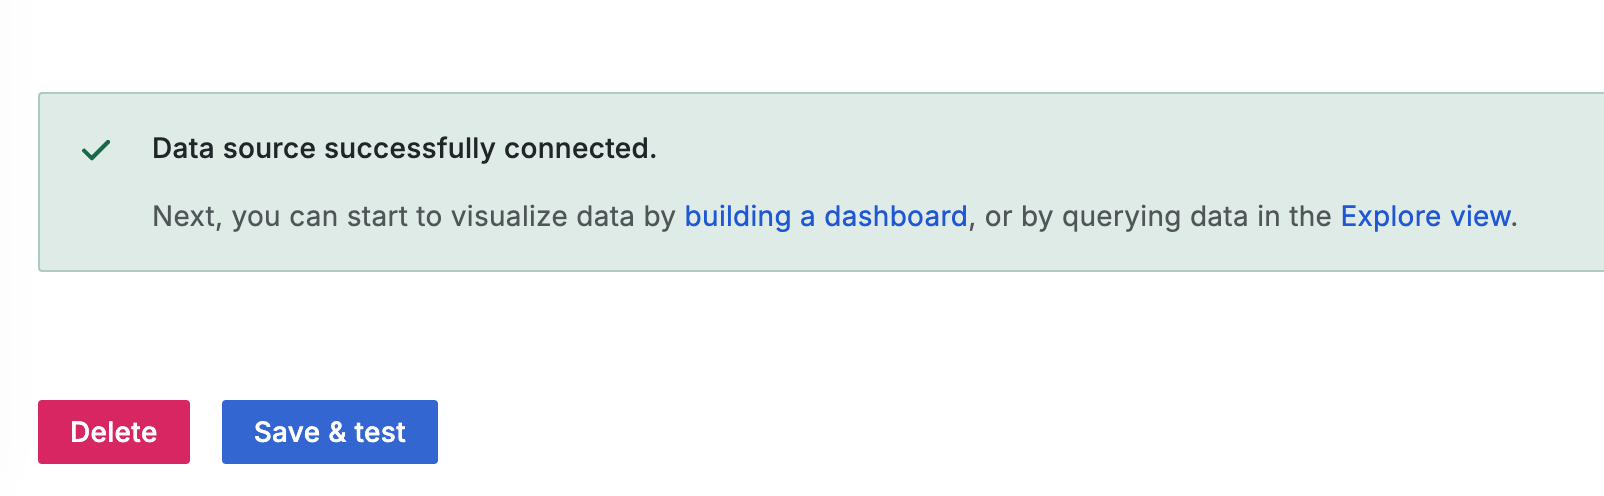
- Click Save & test to verify the connection.
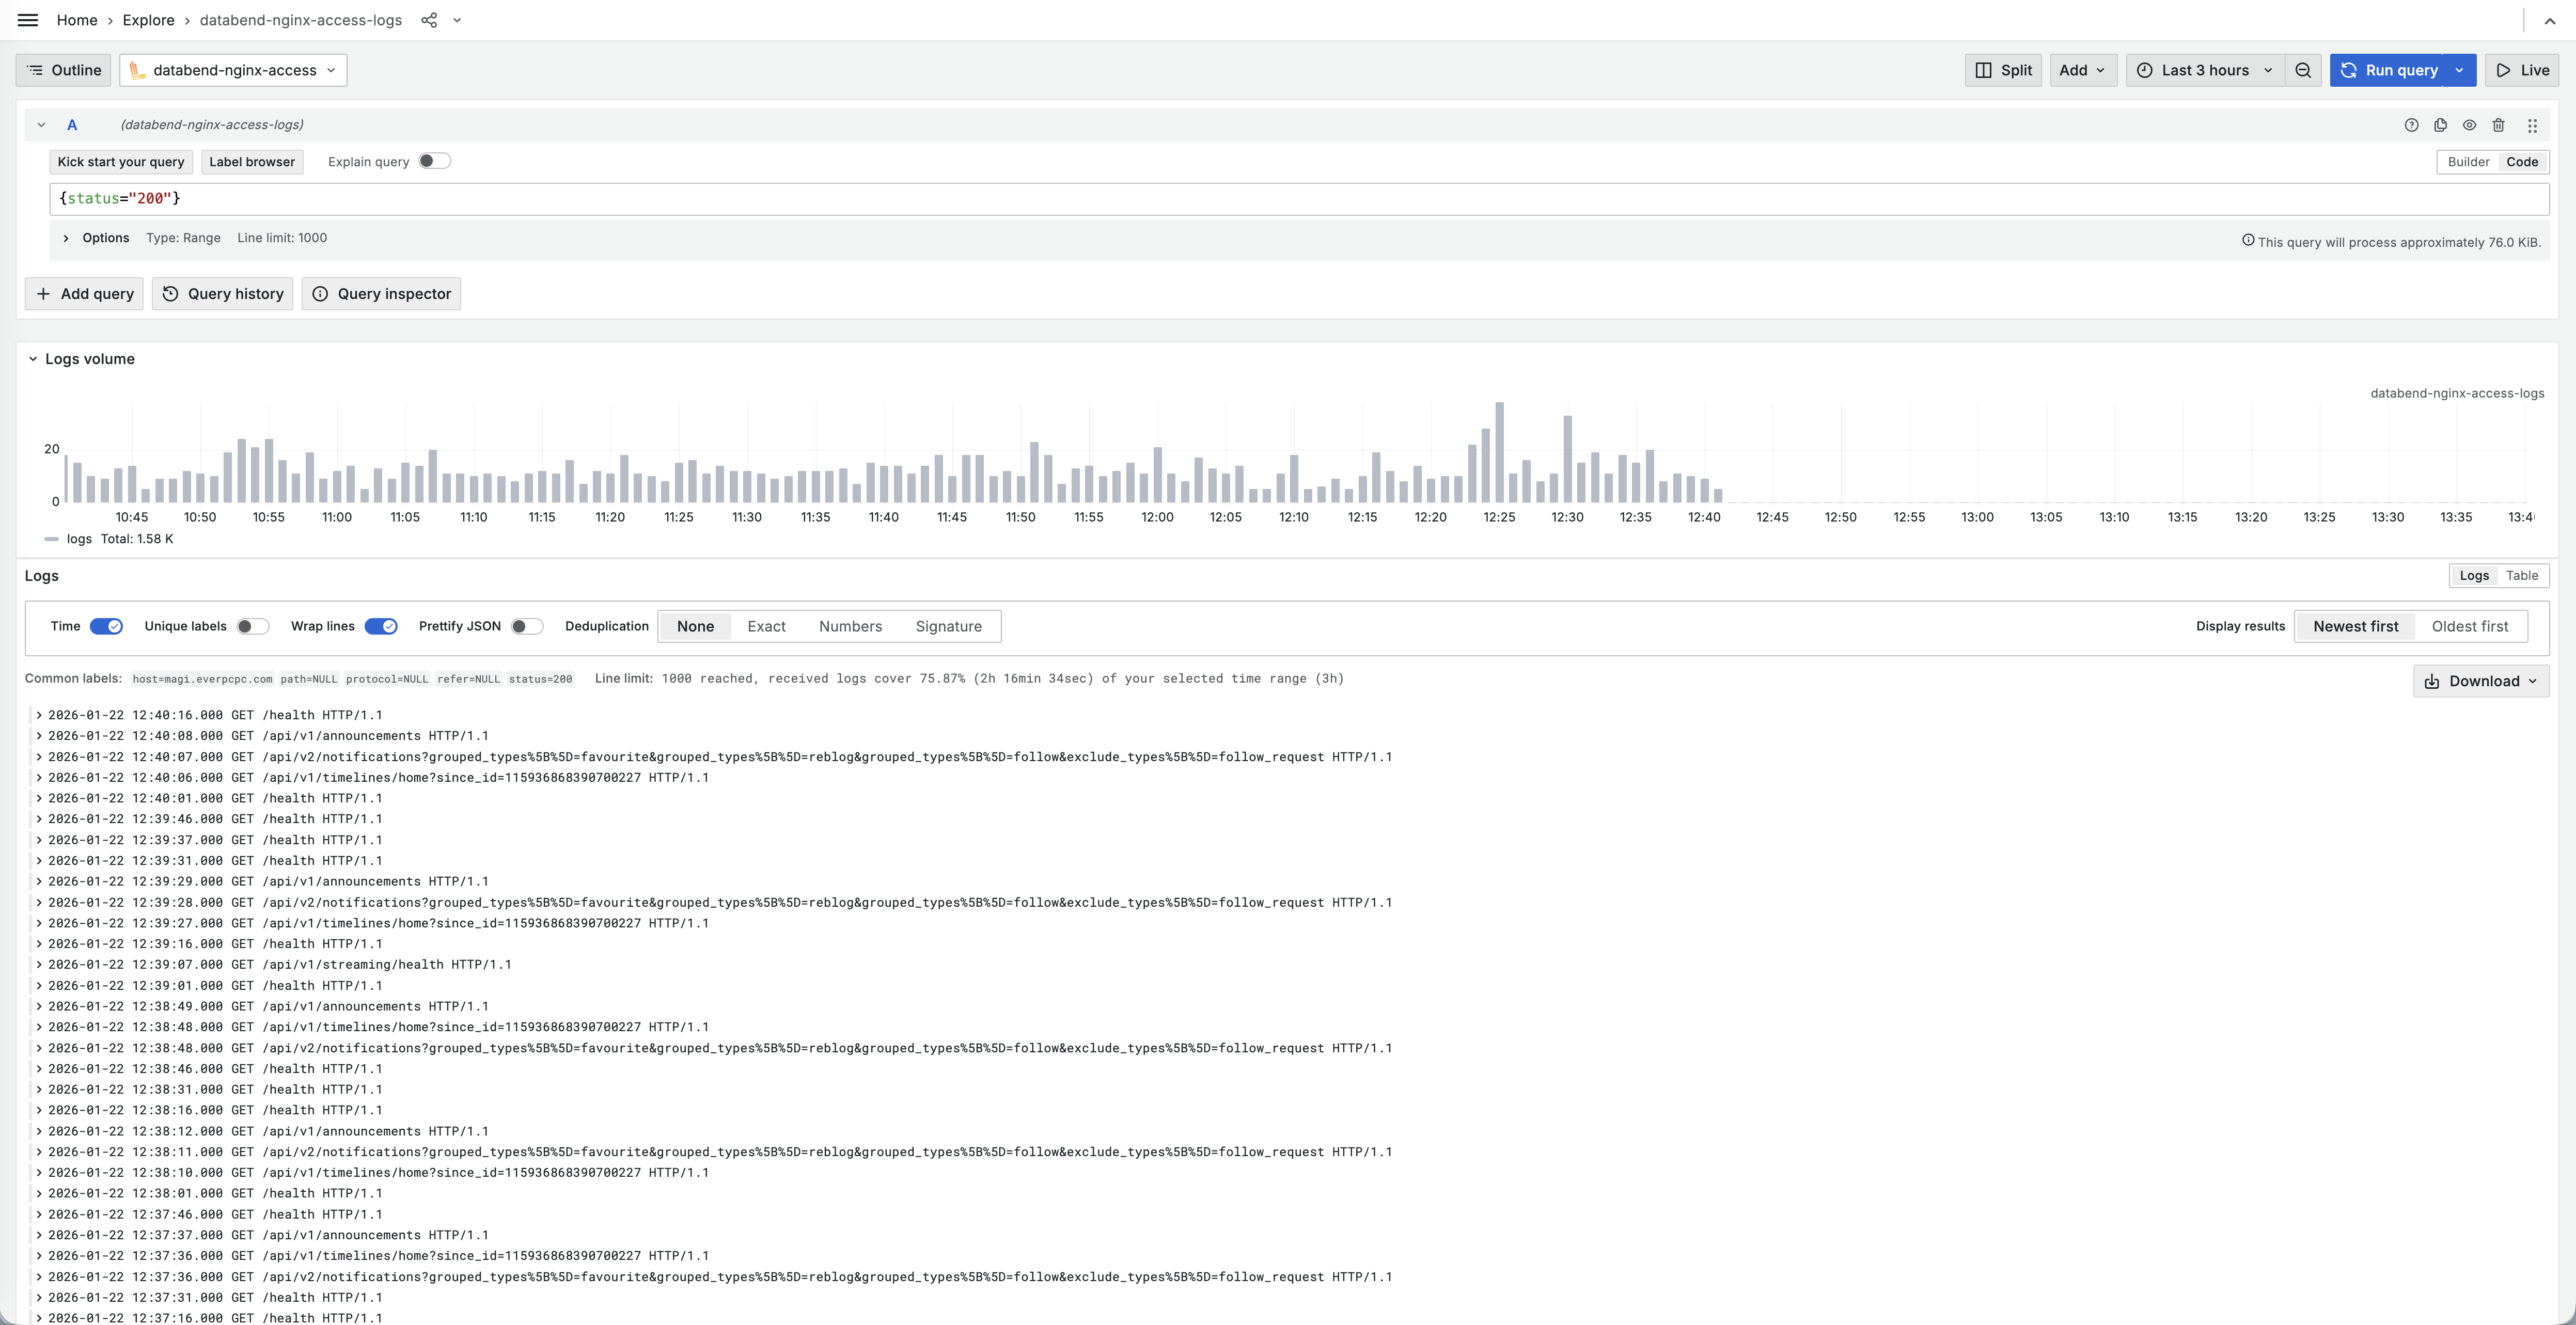
Step 4. Test Queries
-
Navigate to Explore in Grafana.
-
Select your Databend Cloud Loki data source.
-
Use LogQL queries to visualize your data. For example:
{service="api"}- Filter logs by service label{level="error"}- Show only error-level logs{service="api"} |= "timeout"- Search for specific text in logscount_over_time({status="500"}[5m])- Count errors over time
-
Customize the visualization as needed using Grafana's panel options.